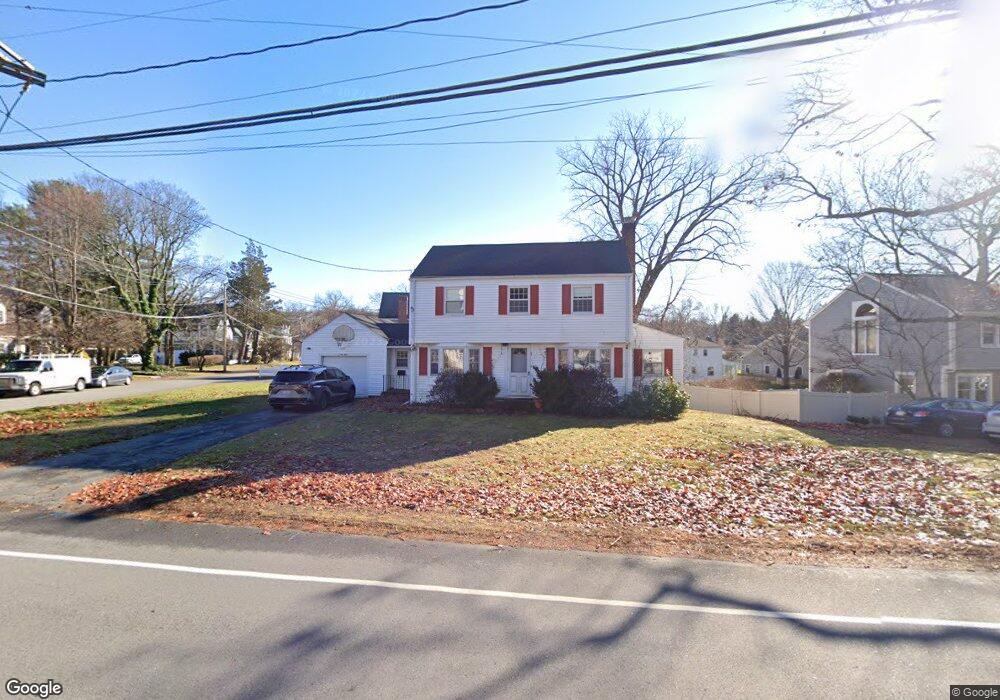
38 Grove St Winchester, MA 01890
Grove Street NeighborhoodEstimated Value: $1,823,000 - $2,337,712
4
Beds
4
Baths
3,650
Sq Ft
$550/Sq Ft
Est. Value
About This Home
This home is located at 38 Grove St, Winchester, MA 01890 and is currently estimated at $2,006,178, approximately $549 per square foot. 38 Grove St is a home located in Middlesex County with nearby schools including Ambrose Elementary School, McCall Middle School, and Winchester High School.
Ownership History
Date
Name
Owned For
Owner Type
Purchase Details
Closed on
Apr 22, 2022
Sold by
Mcgonagle Daniel R and Mcgonagle Susan A
Bought by
Baer Kevin A and Baer Devyn
Current Estimated Value
Home Financials for this Owner
Home Financials are based on the most recent Mortgage that was taken out on this home.
Original Mortgage
$475,000
Outstanding Balance
$442,648
Interest Rate
3.85%
Mortgage Type
Purchase Money Mortgage
Estimated Equity
$1,563,530
Purchase Details
Closed on
Jun 9, 1976
Bought by
Mcgonagle Daniel and Mcgonagle Susan A
Create a Home Valuation Report for This Property
The Home Valuation Report is an in-depth analysis detailing your home's value as well as a comparison with similar homes in the area
Home Values in the Area
Average Home Value in this Area
Purchase History
| Date | Buyer | Sale Price | Title Company |
|---|---|---|---|
| Baer Kevin A | $1,050,000 | None Available | |
| Mcgonagle Daniel | $54,000 | -- |
Source: Public Records
Mortgage History
| Date | Status | Borrower | Loan Amount |
|---|---|---|---|
| Open | Baer Kevin A | $475,000 | |
| Previous Owner | Mcgonagle Daniel | $49,179 | |
| Previous Owner | Mcgonagle Daniel | $33,294 | |
| Previous Owner | Mcgonagle Daniel | $23,168 |
Source: Public Records
Tax History Compared to Growth
Tax History
| Year | Tax Paid | Tax Assessment Tax Assessment Total Assessment is a certain percentage of the fair market value that is determined by local assessors to be the total taxable value of land and additions on the property. | Land | Improvement |
|---|---|---|---|---|
| 2025 | $207 | $1,864,900 | $863,000 | $1,001,900 |
| 2024 | $13,543 | $1,195,300 | $863,000 | $332,300 |
| 2023 | $12,895 | $1,092,800 | $759,400 | $333,400 |
| 2022 | $12,579 | $1,005,500 | $690,400 | $315,100 |
| 2021 | $12,014 | $936,400 | $621,300 | $315,100 |
| 2020 | $11,602 | $936,400 | $621,300 | $315,100 |
| 2019 | $10,504 | $867,400 | $552,300 | $315,100 |
| 2018 | $9,809 | $804,700 | $498,800 | $305,900 |
| 2017 | $8,799 | $716,500 | $428,900 | $287,600 |
| 2016 | $7,986 | $683,700 | $403,900 | $279,800 |
| 2015 | $8,167 | $672,700 | $403,900 | $268,800 |
| 2014 | $7,544 | $595,900 | $336,600 | $259,300 |
Source: Public Records
Map
Nearby Homes