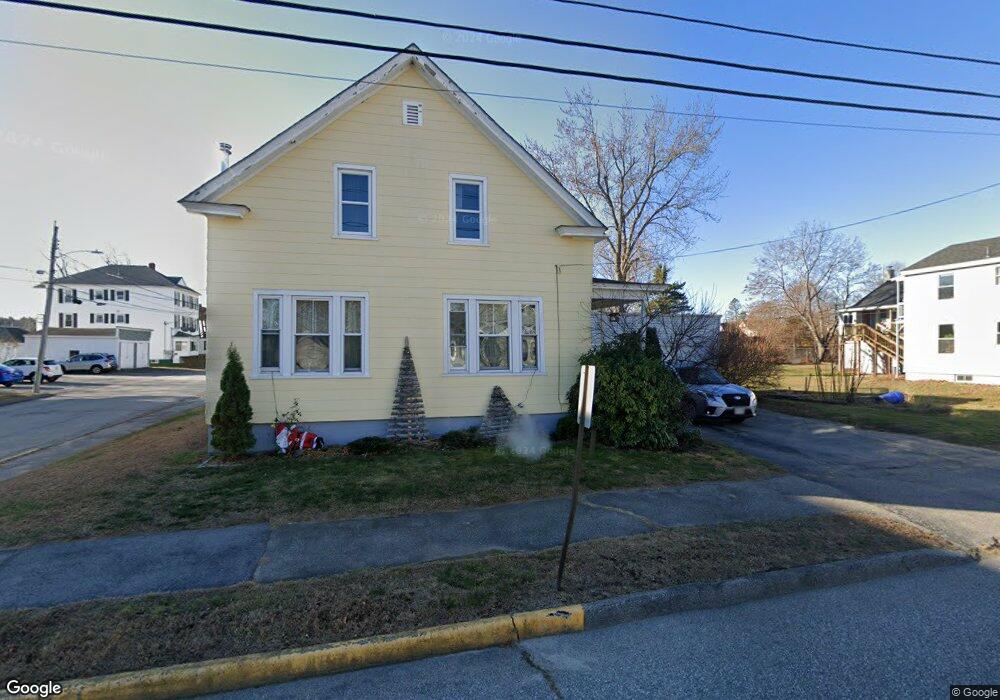
38 Harding St Biddeford, ME 04005
Estimated Value: $384,000 - $441,000
4
Beds
1
Bath
1,350
Sq Ft
$297/Sq Ft
Est. Value
About This Home
This home is located at 38 Harding St, Biddeford, ME 04005 and is currently estimated at $400,531, approximately $296 per square foot. 38 Harding St is a home located in York County with nearby schools including John F Kennedy Memorial School, Biddeford Primary School, and Biddeford Intermediate School.
Ownership History
Date
Name
Owned For
Owner Type
Purchase Details
Closed on
Jun 17, 2024
Sold by
Chaples Jessica and Graffam Eric
Bought by
Graffam-Chaples Ret and Chaples
Current Estimated Value
Purchase Details
Closed on
Apr 23, 2020
Sold by
Graffam Eric W
Bought by
Graffam Eric W and Chaples Jessica
Home Financials for this Owner
Home Financials are based on the most recent Mortgage that was taken out on this home.
Original Mortgage
$164,800
Interest Rate
3.5%
Mortgage Type
New Conventional
Purchase Details
Closed on
Sep 22, 2009
Sold by
Bouthillette Normand J and Marcoux Ann H
Bought by
Graffam Eric W
Home Financials for this Owner
Home Financials are based on the most recent Mortgage that was taken out on this home.
Original Mortgage
$335,204
Interest Rate
5.28%
Mortgage Type
FHA
Create a Home Valuation Report for This Property
The Home Valuation Report is an in-depth analysis detailing your home's value as well as a comparison with similar homes in the area
Home Values in the Area
Average Home Value in this Area
Purchase History
| Date | Buyer | Sale Price | Title Company |
|---|---|---|---|
| Graffam-Chaples Ret | -- | None Available | |
| Graffam-Chaples Ret | -- | None Available | |
| Graffam Eric W | -- | None Available | |
| Graffam Eric W | -- | None Available | |
| Graffam Eric W | -- | None Available | |
| Graffam Eric W | -- | -- | |
| Graffam Eric W | -- | -- |
Source: Public Records
Mortgage History
| Date | Status | Borrower | Loan Amount |
|---|---|---|---|
| Previous Owner | Graffam Eric W | $164,800 | |
| Previous Owner | Graffam Eric W | $335,204 |
Source: Public Records
Tax History
| Year | Tax Paid | Tax Assessment Tax Assessment Total Assessment is a certain percentage of the fair market value that is determined by local assessors to be the total taxable value of land and additions on the property. | Land | Improvement |
|---|---|---|---|---|
| 2025 | $3,656 | $244,700 | $138,100 | $106,600 |
| 2024 | $3,450 | $242,600 | $138,100 | $104,500 |
| 2023 | $3,150 | $240,100 | $135,600 | $104,500 |
| 2022 | $3,103 | $189,100 | $77,900 | $111,200 |
| 2021 | $2,924 | $160,400 | $65,900 | $94,500 |
| 2020 | $0 | $147,500 | $59,900 | $87,600 |
| 2019 | $2,947 | $147,500 | $59,900 | $87,600 |
| 2018 | $2,906 | $147,500 | $59,900 | $87,600 |
| 2017 | $2,822 | $140,600 | $59,900 | $80,700 |
| 2016 | $2,792 | $140,600 | $59,900 | $80,700 |
| 2015 | $2,737 | $140,600 | $59,900 | $80,700 |
| 2014 | $2,670 | $140,600 | $59,900 | $80,700 |
| 2013 | -- | $150,400 | $58,100 | $92,300 |
Source: Public Records
Map
Nearby Homes
- 30 Harding St Unit 32
- 30-32 Harding St
- 2 Gertrude Ave
- 35 Harding St
- 23 Harding St
- 39 Harding St
- 44 Harding St
- 20 Harding St
- 4 Gertrude Ave
- 7 Gertrude Ave
- 12 Herring Ave
- 20 Herring Ave
- 10 Herring Ave
- 50 Harding St
- 31 Herring Avenue Extension
- 52 Harding St
- 10 Gertrude Ave
- 4 Herring Ave
- 179 Graham St
- 5 Harding St
Your Personal Tour Guide
Ask me questions while you tour the home.