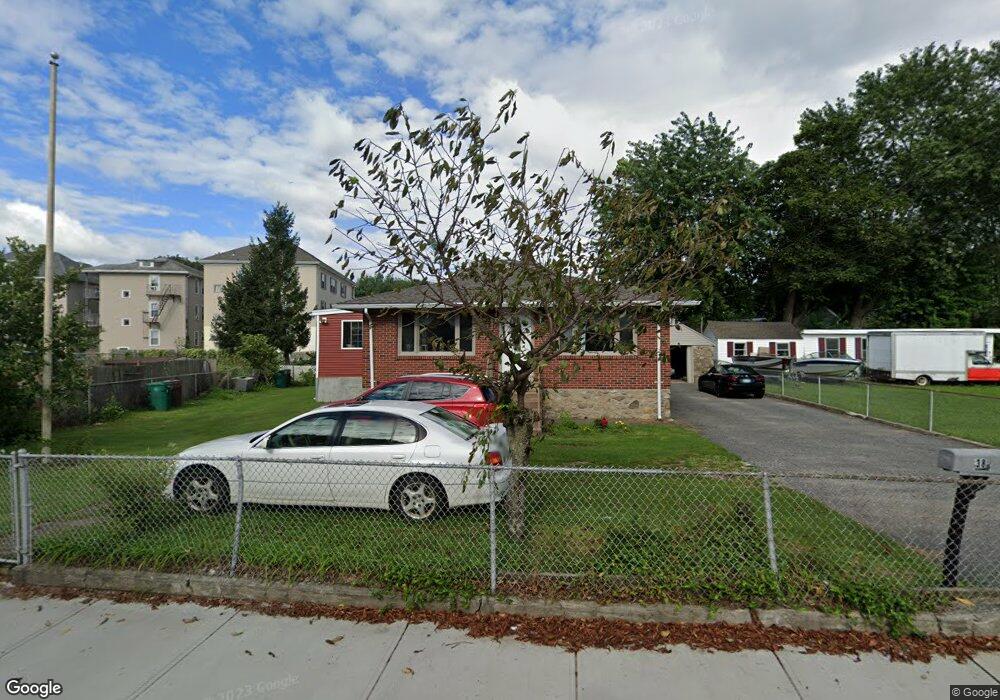
38 Hebert Ave Woonsocket, RI 02895
East Woonsocket NeighborhoodEstimated Value: $362,000 - $456,000
4
Beds
2
Baths
2,220
Sq Ft
$181/Sq Ft
Est. Value
About This Home
This home is located at 38 Hebert Ave, Woonsocket, RI 02895 and is currently estimated at $402,667, approximately $181 per square foot. 38 Hebert Ave is a home located in Providence County with nearby schools including Woonsocket High School and Good Shepherd Catholic School.
Ownership History
Date
Name
Owned For
Owner Type
Purchase Details
Closed on
May 14, 1998
Sold by
Whipple Rose Marie and Casey Anita
Bought by
Sikhao Daopheth
Current Estimated Value
Home Financials for this Owner
Home Financials are based on the most recent Mortgage that was taken out on this home.
Original Mortgage
$81,800
Interest Rate
7.08%
Mortgage Type
Purchase Money Mortgage
Create a Home Valuation Report for This Property
The Home Valuation Report is an in-depth analysis detailing your home's value as well as a comparison with similar homes in the area
Home Values in the Area
Average Home Value in this Area
Purchase History
| Date | Buyer | Sale Price | Title Company |
|---|---|---|---|
| Sikhao Daopheth | $90,000 | -- | |
| Sikhao Daopheth | $90,000 | -- |
Source: Public Records
Mortgage History
| Date | Status | Borrower | Loan Amount |
|---|---|---|---|
| Open | Sikhao Daopheth | $130,000 | |
| Closed | Sikhao Daopheth | $81,800 |
Source: Public Records
Tax History
| Year | Tax Paid | Tax Assessment Tax Assessment Total Assessment is a certain percentage of the fair market value that is determined by local assessors to be the total taxable value of land and additions on the property. | Land | Improvement |
|---|---|---|---|---|
| 2025 | $3,979 | $354,300 | $90,000 | $264,300 |
| 2024 | $3,744 | $257,500 | $91,600 | $165,900 |
| 2023 | $3,600 | $257,500 | $91,600 | $165,900 |
| 2022 | $3,600 | $257,500 | $91,600 | $165,900 |
| 2021 | $3,031 | $127,600 | $37,400 | $90,200 |
| 2020 | $3,062 | $127,600 | $37,400 | $90,200 |
| 2018 | $3,073 | $127,600 | $37,400 | $90,200 |
| 2017 | $3,582 | $119,000 | $40,900 | $78,100 |
| 2016 | $3,789 | $119,000 | $40,900 | $78,100 |
| 2015 | $4,353 | $119,000 | $40,900 | $78,100 |
| 2014 | $3,859 | $118,000 | $45,000 | $73,000 |
Source: Public Records
Map
Nearby Homes
- 568 Elm St
- 56 Mailloux St
- 311 Elm St
- 263 Elm St
- 372 Cumberland Hill Rd
- 40 Burnside Ave
- 366 Aylsworth Ave
- 685 Social St Unit 308
- 685 Social St Unit 313
- 551 Wood Ave
- 538 Wood Ave
- 18 Villa Nova St
- 213 St Louis Ave
- 68 Kenwood St
- 410 Carrington Ave
- 375 Congress St
- 404 Carrington Ave
- 90 Mill St Unit 202
- 212 Saint Louis Ave
- 92 Mill St Unit 303
- 328 Cass Ave
- 58 Sweet Ave
- 314 Cass Ave
- 60 Hebert Ave
- 37 Hebert Ave
- 24 Sweet Ave
- 19 Hebert Ave Unit 3R
- 19 Hebert Ave
- 49 Hebert Ave
- 49 Hebert Ave Unit 3F
- 49 Hebert Ave Unit 2F
- 41 Hebert Ave
- 41 Hebert Ave Unit 1
- 64 Sweet Ave
- 12 Sweet Ave
- 66 Sweet Ave
- 72 Hebert Ave
- 63 Hebert Ave
- 63 Hebert Ave Unit A
- 63 Hebert Ave Unit 2
Your Personal Tour Guide
Ask me questions while you tour the home.