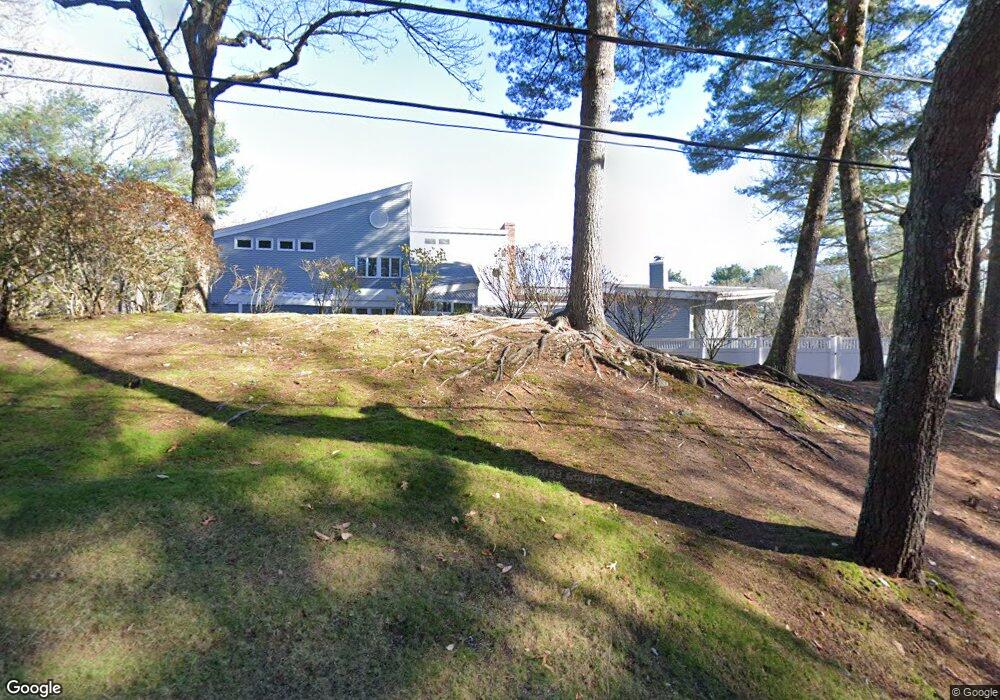
38 High Rock Rd Wayland, MA 01778
Estimated Value: $2,090,000 - $2,376,000
5
Beds
7
Baths
5,685
Sq Ft
$391/Sq Ft
Est. Value
About This Home
This home is located at 38 High Rock Rd, Wayland, MA 01778 and is currently estimated at $2,221,694, approximately $390 per square foot. 38 High Rock Rd is a home located in Middlesex County with nearby schools including Wayland High School, Veritas Christian Academy, and The Rivers School.
Ownership History
Date
Name
Owned For
Owner Type
Purchase Details
Closed on
Jan 13, 2012
Sold by
Miller Greg
Bought by
Mann Stephanie and Miller Michael
Current Estimated Value
Home Financials for this Owner
Home Financials are based on the most recent Mortgage that was taken out on this home.
Original Mortgage
$850,000
Outstanding Balance
$583,292
Interest Rate
4%
Mortgage Type
Purchase Money Mortgage
Estimated Equity
$1,638,402
Purchase Details
Closed on
May 2, 2011
Sold by
Valone James W and Hanna-Valone Lisa
Bought by
Miller Greg
Purchase Details
Closed on
Apr 29, 1997
Sold by
Karp Harvey M and Karp Holly P
Bought by
Valone James W and Hanna-Valone Lisa
Create a Home Valuation Report for This Property
The Home Valuation Report is an in-depth analysis detailing your home's value as well as a comparison with similar homes in the area
Home Values in the Area
Average Home Value in this Area
Purchase History
| Date | Buyer | Sale Price | Title Company |
|---|---|---|---|
| Mann Stephanie | $1,250,000 | -- | |
| Miller Greg | $1,248,000 | -- | |
| Valone James W | $595,000 | -- | |
| Mann Stephanie | $1,250,000 | -- | |
| Miller Greg | $1,248,000 | -- | |
| Valone James W | $595,000 | -- |
Source: Public Records
Mortgage History
| Date | Status | Borrower | Loan Amount |
|---|---|---|---|
| Open | Valone James W | $850,000 | |
| Closed | Valone James W | $850,000 |
Source: Public Records
Tax History Compared to Growth
Tax History
| Year | Tax Paid | Tax Assessment Tax Assessment Total Assessment is a certain percentage of the fair market value that is determined by local assessors to be the total taxable value of land and additions on the property. | Land | Improvement |
|---|---|---|---|---|
| 2025 | $29,438 | $1,883,400 | $694,700 | $1,188,700 |
| 2024 | $27,916 | $1,798,700 | $661,500 | $1,137,200 |
| 2023 | $26,513 | $1,592,400 | $602,500 | $989,900 |
| 2022 | $26,690 | $1,454,500 | $501,500 | $953,000 |
| 2021 | $14,458 | $1,410,400 | $457,400 | $953,000 |
| 2020 | $25,191 | $1,418,400 | $457,400 | $961,000 |
| 2019 | $25,009 | $1,368,100 | $436,400 | $931,700 |
| 2018 | $23,931 | $1,327,300 | $436,400 | $890,900 |
| 2017 | $22,840 | $1,259,100 | $422,500 | $836,600 |
| 2016 | $22,226 | $1,281,800 | $431,600 | $850,200 |
| 2015 | $22,699 | $1,234,300 | $431,600 | $802,700 |
Source: Public Records
Map
Nearby Homes
- 38 High Rock Rd
- 34 High Rock Rd
- 34 High Rock Rd Unit 1
- 43 High Rock Rd
- 44 High Rock Rd
- 31 High Rock Rd
- 37 High Rock Rd
- 26 High Rock Rd
- 59 Woodridge Rd
- 50 High Rock Rd
- 35 High Rock Rd
- 49 High Rock Rd
- 63 Woodridge Rd
- 21 Barney Hill Rd
- 33 High Rock Rd
- 22 High Rock Rd
- 29 High Rock Rd
- 65 Woodridge Rd
- 55 Woodridge Rd
- 25 Barney Hill Rd