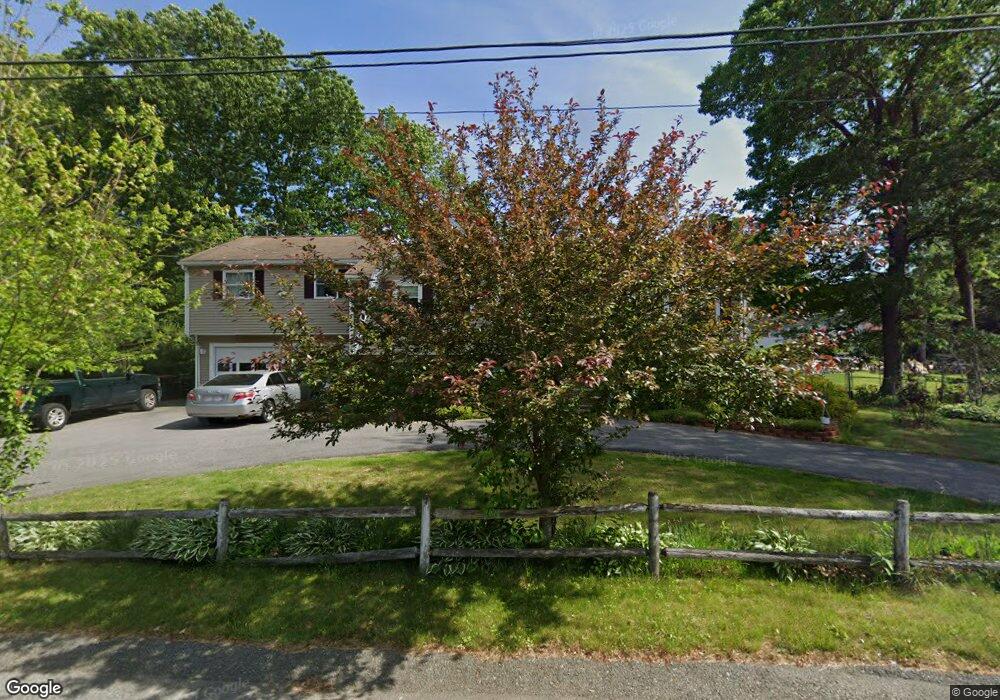
38 Highfield Dr Brockton, MA 02301
Clifton Heights NeighborhoodEstimated Value: $646,000 - $724,000
4
Beds
3
Baths
2,080
Sq Ft
$323/Sq Ft
Est. Value
About This Home
This home is located at 38 Highfield Dr, Brockton, MA 02301 and is currently estimated at $671,190, approximately $322 per square foot. 38 Highfield Dr is a home located in Plymouth County with nearby schools including Gilmore Elementary School, John F. Kennedy Elementary School, and Davis K-8 School.
Ownership History
Date
Name
Owned For
Owner Type
Purchase Details
Closed on
Jan 7, 2020
Sold by
Moukit Morris A and Moukit Deborah M
Bought by
Moukit Morris A
Current Estimated Value
Purchase Details
Closed on
Oct 31, 2011
Sold by
Botelho Jonh P and Botelho Eulalia M
Bought by
Moukit Morris and Moukit Deborah M
Home Financials for this Owner
Home Financials are based on the most recent Mortgage that was taken out on this home.
Original Mortgage
$285,451
Interest Rate
3.87%
Mortgage Type
FHA
Create a Home Valuation Report for This Property
The Home Valuation Report is an in-depth analysis detailing your home's value as well as a comparison with similar homes in the area
Home Values in the Area
Average Home Value in this Area
Purchase History
| Date | Buyer | Sale Price | Title Company |
|---|---|---|---|
| Moukit Morris A | -- | None Available | |
| Moukit Morris | $297,500 | -- |
Source: Public Records
Mortgage History
| Date | Status | Borrower | Loan Amount |
|---|---|---|---|
| Previous Owner | Moukit Morris | $285,451 |
Source: Public Records
Tax History Compared to Growth
Tax History
| Year | Tax Paid | Tax Assessment Tax Assessment Total Assessment is a certain percentage of the fair market value that is determined by local assessors to be the total taxable value of land and additions on the property. | Land | Improvement |
|---|---|---|---|---|
| 2025 | $6,373 | $526,300 | $156,500 | $369,800 |
| 2024 | $6,291 | $523,400 | $156,500 | $366,900 |
| 2023 | $6,214 | $478,700 | $122,300 | $356,400 |
| 2022 | $5,454 | $390,400 | $111,500 | $278,900 |
| 2021 | $5,087 | $350,800 | $102,300 | $248,500 |
| 2020 | $5,492 | $362,500 | $98,000 | $264,500 |
| 2019 | $5,598 | $360,200 | $91,400 | $268,800 |
| 2018 | $4,964 | $309,100 | $91,400 | $217,700 |
| 2017 | $4,650 | $288,800 | $91,400 | $197,400 |
| 2016 | $4,965 | $286,000 | $87,800 | $198,200 |
| 2015 | $4,792 | $264,000 | $87,800 | $176,200 |
| 2014 | $5,037 | $277,800 | $87,800 | $190,000 |
Source: Public Records
Map
Nearby Homes
- 46 Highfield Dr
- 30 Highfield Dr
- 20 Linwood Park
- 12 Linwood Park
- 30 Linwood Park
- 31 Highfield Dr
- 45 Highfield Dr
- 22 Highfield Dr
- 224 Linwood St
- 234 Linwood St
- 25 Linwood Park
- 23 Highfield Dr
- 55 Highfield Dr
- 25 Olde Farm Ln
- 14 Highfield Dr
- 5 Linwood Park
- 22 Colleen Dr
- 14 Colleen Dr
- 12 Olde Farm Ln
- 15 Highfield Dr