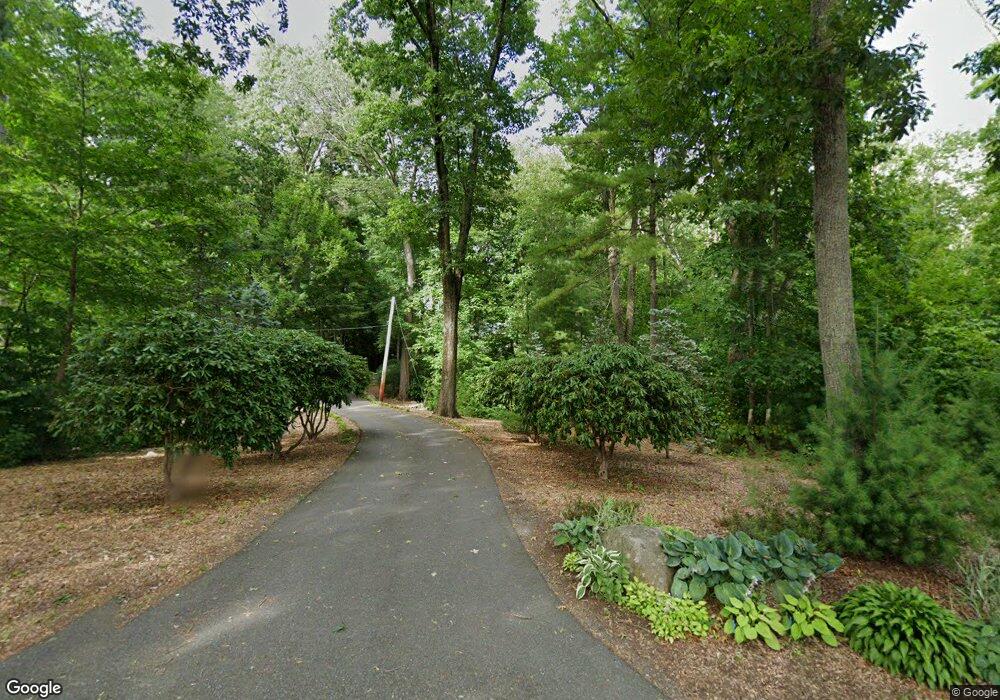
38 Highland St Medway, MA 02053
Estimated Value: $589,000 - $706,000
3
Beds
2
Baths
1,148
Sq Ft
$561/Sq Ft
Est. Value
About This Home
This home is located at 38 Highland St, Medway, MA 02053 and is currently estimated at $644,246, approximately $561 per square foot. 38 Highland St is a home located in Norfolk County with nearby schools including John D. McGovern Elementary School, Burke-Memorial Elementary, and Medway Middle School.
Ownership History
Date
Name
Owned For
Owner Type
Purchase Details
Closed on
Apr 30, 2024
Sold by
Bannon Lynda and Bannon Madge Johanna
Bought by
Madge-Bannon Ret and Bannon
Current Estimated Value
Purchase Details
Closed on
Dec 8, 1997
Sold by
Rider Charles L
Bought by
Bannon Lynda
Home Financials for this Owner
Home Financials are based on the most recent Mortgage that was taken out on this home.
Original Mortgage
$148,000
Interest Rate
7.28%
Mortgage Type
Purchase Money Mortgage
Purchase Details
Closed on
Mar 27, 1992
Sold by
Baybank
Bought by
Rider Charles L
Purchase Details
Closed on
Mar 24, 1992
Sold by
Mdsx Baybank
Bought by
Baybank-Norf Cty Tr
Create a Home Valuation Report for This Property
The Home Valuation Report is an in-depth analysis detailing your home's value as well as a comparison with similar homes in the area
Home Values in the Area
Average Home Value in this Area
Purchase History
| Date | Buyer | Sale Price | Title Company |
|---|---|---|---|
| Madge-Bannon Ret | -- | None Available | |
| Madge-Bannon Ret | -- | None Available | |
| Bannon Lynda | $185,000 | -- | |
| Rider Charles L | $142,250 | -- | |
| Baybank-Norf Cty Tr | $20,000 | -- | |
| Bannon Lynda | $185,000 | -- | |
| Rider Charles L | $142,250 | -- | |
| Baybank-Norf Cty Tr | $20,000 | -- |
Source: Public Records
Mortgage History
| Date | Status | Borrower | Loan Amount |
|---|---|---|---|
| Previous Owner | Baybank-Norf Cty Tr | $125,637 | |
| Previous Owner | Baybank-Norf Cty Tr | $148,000 |
Source: Public Records
Tax History Compared to Growth
Tax History
| Year | Tax Paid | Tax Assessment Tax Assessment Total Assessment is a certain percentage of the fair market value that is determined by local assessors to be the total taxable value of land and additions on the property. | Land | Improvement |
|---|---|---|---|---|
| 2025 | $7,048 | $494,600 | $285,900 | $208,700 |
| 2024 | $7,122 | $494,600 | $285,900 | $208,700 |
| 2023 | $7,122 | $446,800 | $246,700 | $200,100 |
| 2022 | $6,718 | $396,800 | $220,600 | $176,200 |
| 2021 | $6,616 | $378,900 | $198,800 | $180,100 |
| 2020 | $6,190 | $353,700 | $177,000 | $176,700 |
| 2019 | $5,889 | $347,000 | $177,000 | $170,000 |
| 2018 | $5,687 | $322,000 | $155,300 | $166,700 |
| 2017 | $5,544 | $309,400 | $144,400 | $165,000 |
| 2016 | $5,507 | $304,100 | $139,100 | $165,000 |
| 2015 | $5,436 | $298,000 | $131,300 | $166,700 |
| 2014 | $5,383 | $285,700 | $140,500 | $145,200 |
Source: Public Records
Map
Nearby Homes
- 6 Freedom Trail
- 5 Fales St
- 220 Main St Unit 220
- 176 Main St Unit 3
- 28 Wellington St
- 39 West St
- 15 Broad Acres Farm Rd
- 12 Longmeadow Ln
- 4 Deerfield Rd
- 14 Heritage Dr
- 78 Fisher St
- 462 Hartford Ave
- 21 Riverside Rd
- 4 Shaw St
- 280 Village St Unit D2
- 6 Rainbow Dr
- 22 Sunset Dr
- 455 Hartford Ave
- 85 Fisher St
- 36 Lovering St