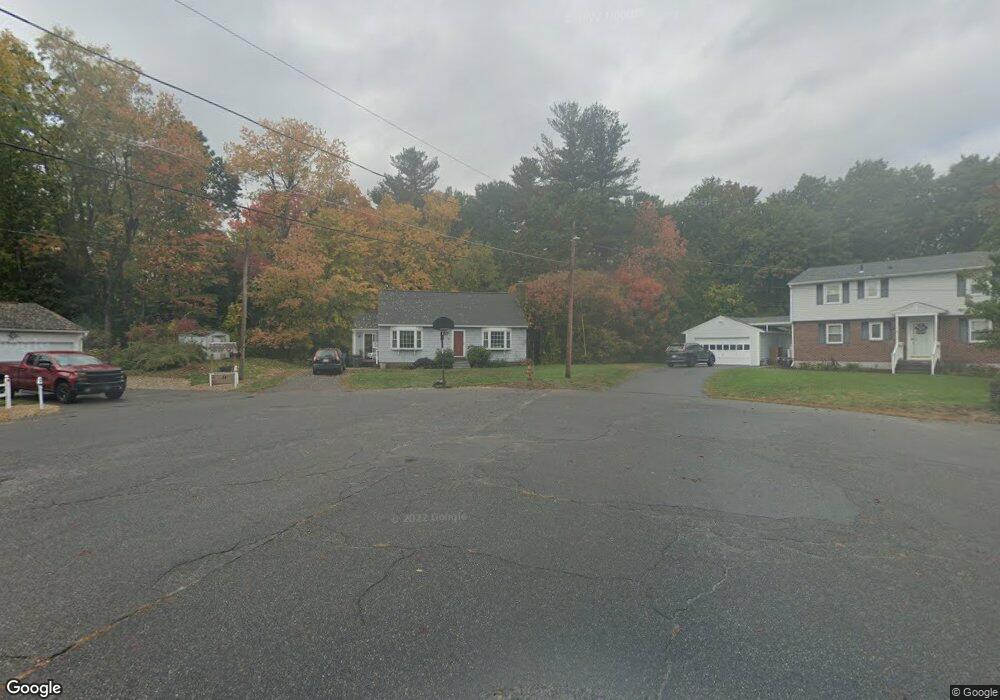
38 Hingham Ct Leominster, MA 01453
Estimated Value: $487,000 - $539,000
3
Beds
3
Baths
1,498
Sq Ft
$347/Sq Ft
Est. Value
About This Home
This home is located at 38 Hingham Ct, Leominster, MA 01453 and is currently estimated at $519,498, approximately $346 per square foot. 38 Hingham Ct is a home located in Worcester County with nearby schools including Leominster High School, St. Leo School, and St. Anna Catholic School.
Ownership History
Date
Name
Owned For
Owner Type
Purchase Details
Closed on
Oct 25, 2004
Sold by
Gardiner Brian D and Valeri Cristina M
Bought by
38 Hingham Court Rt
Current Estimated Value
Purchase Details
Closed on
Nov 7, 1996
Sold by
Erdman Robert C
Bought by
Gardiner Brian
Home Financials for this Owner
Home Financials are based on the most recent Mortgage that was taken out on this home.
Original Mortgage
$107,260
Interest Rate
8.1%
Mortgage Type
Purchase Money Mortgage
Create a Home Valuation Report for This Property
The Home Valuation Report is an in-depth analysis detailing your home's value as well as a comparison with similar homes in the area
Home Values in the Area
Average Home Value in this Area
Purchase History
| Date | Buyer | Sale Price | Title Company |
|---|---|---|---|
| 38 Hingham Court Rt | -- | -- | |
| Gardiner Brian | $109,900 | -- |
Source: Public Records
Mortgage History
| Date | Status | Borrower | Loan Amount |
|---|---|---|---|
| Previous Owner | Gardiner Brian | $168,400 | |
| Previous Owner | Gardiner Brian | $107,260 |
Source: Public Records
Tax History
| Year | Tax Paid | Tax Assessment Tax Assessment Total Assessment is a certain percentage of the fair market value that is determined by local assessors to be the total taxable value of land and additions on the property. | Land | Improvement |
|---|---|---|---|---|
| 2025 | $6,375 | $454,400 | $162,000 | $292,400 |
| 2024 | $6,113 | $421,300 | $154,100 | $267,200 |
| 2023 | $5,882 | $378,500 | $134,000 | $244,500 |
| 2022 | $5,589 | $337,500 | $116,600 | $220,900 |
| 2021 | $5,401 | $297,900 | $91,000 | $206,900 |
| 2020 | $4,989 | $277,500 | $91,000 | $186,500 |
| 2019 | $4,902 | $264,400 | $86,900 | $177,500 |
| 2018 | $4,823 | $249,500 | $84,600 | $164,900 |
| 2017 | $4,526 | $229,400 | $78,900 | $150,500 |
| 2016 | $4,386 | $224,000 | $78,900 | $145,100 |
| 2015 | $4,285 | $220,400 | $78,900 | $141,500 |
| 2014 | $4,095 | $216,800 | $83,200 | $133,600 |
Source: Public Records
Map
Nearby Homes
- 21 Regina Dr
- 19 Kittredge St
- 41 Hill St
- 242 Pleasant St
- 192 Pleasant St Unit 25
- 192 Pleasant St Unit 23
- 46 Franklin St
- 113 Pleasant St
- 60 Pearl St
- 51 Pleasant St
- 144 West St Unit 14
- 6 Chapman Place
- 40 Biscayne St
- LOT 1 Elm St
- 25 Meadow Pond Dr Unit j
- 0 Wheeler St
- 42 Wheeler St
- 16 Depot Square
- 32 Haynes Ct
- 30 Abbey Rd Unit 202
Your Personal Tour Guide
Ask me questions while you tour the home.