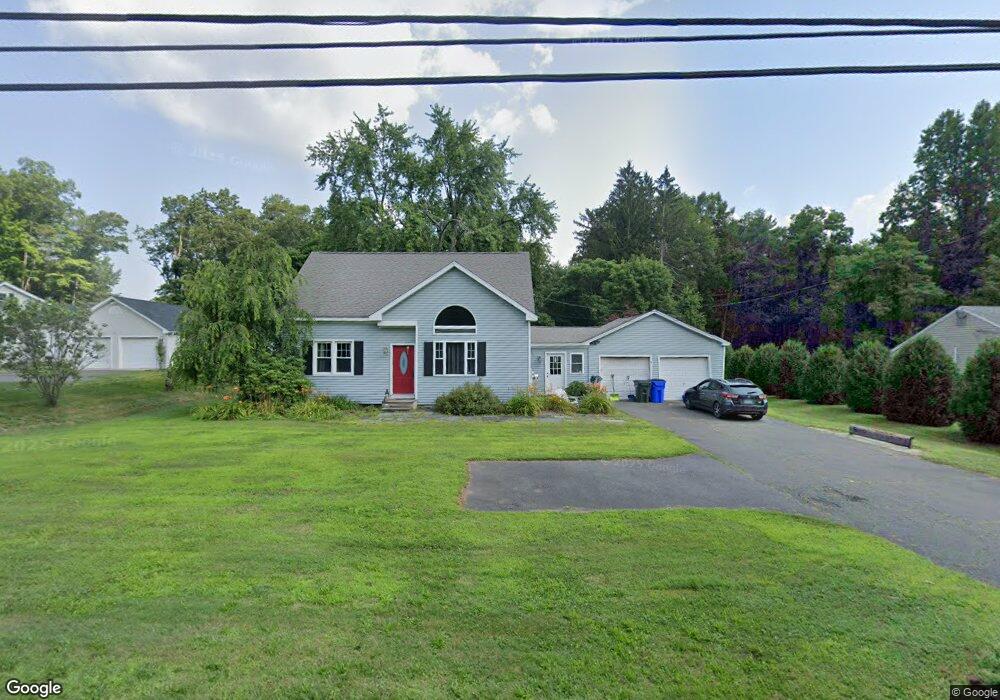
38 Hoskins Rd Simsbury, CT 06070
Estimated Value: $403,000 - $465,604
3
Beds
2
Baths
1,475
Sq Ft
$297/Sq Ft
Est. Value
About This Home
This home is located at 38 Hoskins Rd, Simsbury, CT 06070 and is currently estimated at $437,901, approximately $296 per square foot. 38 Hoskins Rd is a home located in Hartford County with nearby schools including Squadron Line School, Henry James Memorial School, and Simsbury High School.
Ownership History
Date
Name
Owned For
Owner Type
Purchase Details
Closed on
Sep 28, 2007
Sold by
Strempfer James F and Strempfer Rebecca A
Bought by
Strempfer Melissa G and Moss Jarrod P
Current Estimated Value
Home Financials for this Owner
Home Financials are based on the most recent Mortgage that was taken out on this home.
Original Mortgage
$259,000
Interest Rate
6.65%
Purchase Details
Closed on
Apr 22, 1996
Sold by
Girard Bros Corp
Bought by
Strempfer James and Strempfer Rebecca
Purchase Details
Closed on
Jul 26, 1995
Sold by
Klein Frances
Bought by
Edwards Marcus and Edwards Margaret
Purchase Details
Closed on
May 15, 1995
Sold by
Merriman Marion
Bought by
Zachory Constantine B and Zachory Patricia
Purchase Details
Closed on
Mar 27, 1995
Sold by
Schmeig Robert K
Bought by
Mainelli Peter J and Mainelli Karen J
Purchase Details
Closed on
Jan 31, 1995
Sold by
Windsor Locks S&L
Bought by
Mjp Assoc
Create a Home Valuation Report for This Property
The Home Valuation Report is an in-depth analysis detailing your home's value as well as a comparison with similar homes in the area
Home Values in the Area
Average Home Value in this Area
Purchase History
| Date | Buyer | Sale Price | Title Company |
|---|---|---|---|
| Strempfer Melissa G | $259,900 | -- | |
| Strempfer James | $126,260 | -- | |
| Edwards Marcus | $121,500 | -- | |
| Zachory Constantine B | $6,000 | -- | |
| Mainelli Peter J | $143,000 | -- | |
| Mjp Assoc | $7,000 | -- |
Source: Public Records
Mortgage History
| Date | Status | Borrower | Loan Amount |
|---|---|---|---|
| Open | Mjp Assoc | $243,521 | |
| Closed | Mjp Assoc | $259,000 | |
| Previous Owner | Mjp Assoc | $250,000 |
Source: Public Records
Tax History Compared to Growth
Tax History
| Year | Tax Paid | Tax Assessment Tax Assessment Total Assessment is a certain percentage of the fair market value that is determined by local assessors to be the total taxable value of land and additions on the property. | Land | Improvement |
|---|---|---|---|---|
| 2025 | $8,262 | $241,850 | $91,490 | $150,360 |
| 2024 | $8,056 | $241,850 | $91,490 | $150,360 |
| 2023 | $7,696 | $241,850 | $91,490 | $150,360 |
| 2022 | $7,073 | $183,090 | $88,670 | $94,420 |
| 2021 | $7,073 | $183,090 | $88,670 | $94,420 |
| 2020 | $6,791 | $183,090 | $88,670 | $94,420 |
| 2019 | $6,833 | $183,090 | $88,670 | $94,420 |
| 2018 | $6,882 | $183,090 | $88,670 | $94,420 |
| 2017 | $6,116 | $157,790 | $74,550 | $83,240 |
| 2016 | $5,857 | $157,790 | $74,550 | $83,240 |
| 2015 | $5,857 | $157,790 | $74,550 | $83,240 |
| 2014 | $5,860 | $157,790 | $74,550 | $83,240 |
Source: Public Records
Map
Nearby Homes
- 45 Hoskins Rd
- 19 Simsbury Landing
- 26 Winterset Ln
- 21 Berkshire Way
- 14 Gordon St
- 16 Berkshire Way
- 7 Knollwood Cir
- 14 Brettonwood Dr
- 324 Firetown Rd
- 65 Chriswell Dr
- 11 Mallard Cir
- 2 Quail Dr Unit 2
- 14 Teal Cir Unit 14
- 23 Maple St
- 19 Elaine Dr
- 141 Firetown Rd
- 5 Anja Dr
- 14 Main Street Extension
- 9 Tunxis Place
- 5 Tunxis Place Unit C
- 36 Hoskins Rd
- 40 Hoskins Rd
- 34 Hoskins Rd
- 33 Hoskins Rd
- 46 Hoskins Rd
- 31 Hoskins Rd
- 30 Hoskins Rd
- 30 Hoskins Rd
- 29 Hoskins Rd
- 48 Hoskins Rd
- 48A Hoskins Rd
- 102 Cambridge Ct
- 125 Cambridge Ct
- 123 Cambridge Ct
- 124 Cambridge Ct
- 121 Cambridge Ct
- 108 Cambridge Ct
- 93 Cambridge Ct
- 2 Old Barge Rd
- 101 Cambridge Ct