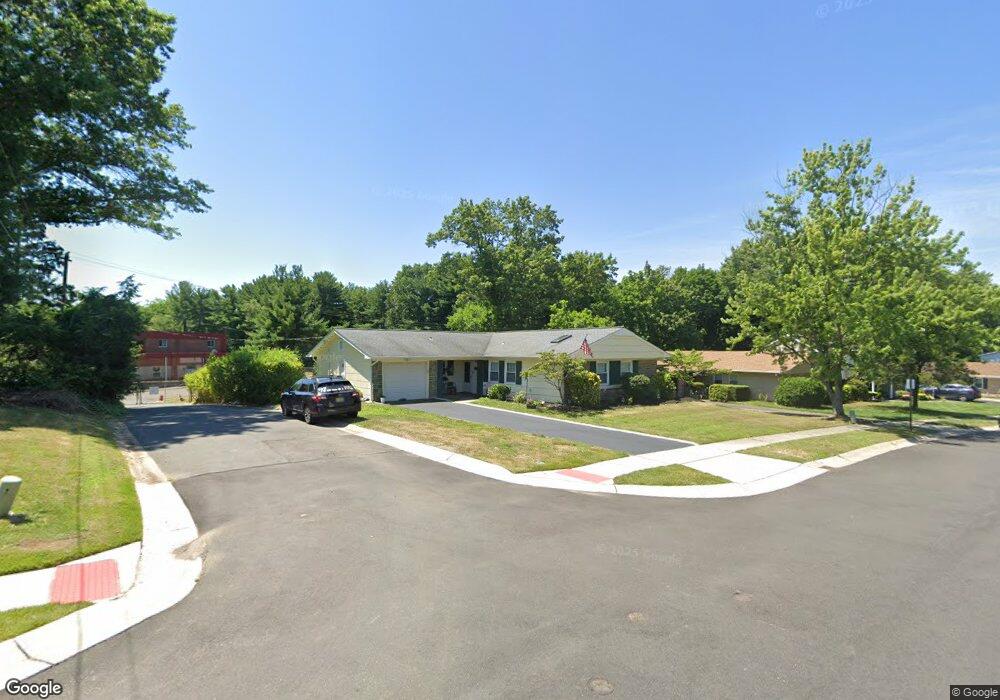
38 Imbrook Ln Matawan, NJ 07747
Estimated Value: $653,653 - $685,000
3
Beds
2
Baths
1,535
Sq Ft
$439/Sq Ft
Est. Value
About This Home
This home is located at 38 Imbrook Ln, Matawan, NJ 07747 and is currently estimated at $673,663, approximately $438 per square foot. 38 Imbrook Ln is a home located in Monmouth County with nearby schools including Matawan Reg High School, St Benedict School, and St. Joseph Elementary School.
Ownership History
Date
Name
Owned For
Owner Type
Purchase Details
Closed on
Jan 13, 2024
Sold by
Cleaves James D and Cleaves Sheri L
Bought by
Cleaves Sheri L
Current Estimated Value
Home Financials for this Owner
Home Financials are based on the most recent Mortgage that was taken out on this home.
Original Mortgage
$317,375
Outstanding Balance
$311,466
Interest Rate
6.62%
Mortgage Type
New Conventional
Estimated Equity
$362,197
Purchase Details
Closed on
Aug 1, 1990
Bought by
Tschopp Sheri Lee
Create a Home Valuation Report for This Property
The Home Valuation Report is an in-depth analysis detailing your home's value as well as a comparison with similar homes in the area
Home Values in the Area
Average Home Value in this Area
Purchase History
| Date | Buyer | Sale Price | Title Company |
|---|---|---|---|
| Cleaves Sheri L | $53,500 | Amrock | |
| Cleaves Sheri L | $53,500 | Amrock | |
| Tschopp Sheri Lee | $143,000 | -- |
Source: Public Records
Mortgage History
| Date | Status | Borrower | Loan Amount |
|---|---|---|---|
| Open | Cleaves Sheri L | $317,375 | |
| Closed | Cleaves Sheri L | $317,375 |
Source: Public Records
Tax History
| Year | Tax Paid | Tax Assessment Tax Assessment Total Assessment is a certain percentage of the fair market value that is determined by local assessors to be the total taxable value of land and additions on the property. | Land | Improvement |
|---|---|---|---|---|
| 2025 | $10,329 | $582,300 | $437,700 | $144,600 |
| 2024 | $9,824 | $511,100 | $369,200 | $141,900 |
| 2023 | $9,824 | $459,300 | $320,700 | $138,600 |
| 2022 | $9,282 | $381,800 | $250,200 | $131,600 |
| 2021 | $9,521 | $343,400 | $226,400 | $117,000 |
| 2020 | $9,521 | $350,800 | $236,400 | $114,400 |
| 2019 | $9,391 | $336,100 | $222,400 | $113,700 |
| 2018 | $8,983 | $322,300 | $213,900 | $108,400 |
| 2017 | $8,478 | $308,500 | $193,900 | $114,600 |
| 2016 | $7,888 | $299,600 | $187,900 | $111,700 |
| 2015 | $8,330 | $303,700 | $194,900 | $108,800 |
| 2014 | $7,909 | $294,000 | $185,900 | $108,100 |
Source: Public Records
Map
Nearby Homes
- 104 Idolstone Ln
- 17 Idlebrook Ln
- 99 Idlebrook Ln
- 72 Idlebrook Ln
- 20 Galway Dr
- 9 Tralee Rd
- 16 Galway Dr
- 114 Dundee Ct
- 3 Tolas Dr
- 323 Arlene Terrace
- 120 Andover Ln
- 184 Edinburgh Ct Unit 184
- 15 Janine Place
- 9 Amherst Ct
- 315 Wellington Place
- 16 S Beers St
- 537 S Atlantic Ave
- 611 Wellington Place
- 283 Gloucester Ct
- 244 Lloyd Rd
Your Personal Tour Guide
Ask me questions while you tour the home.