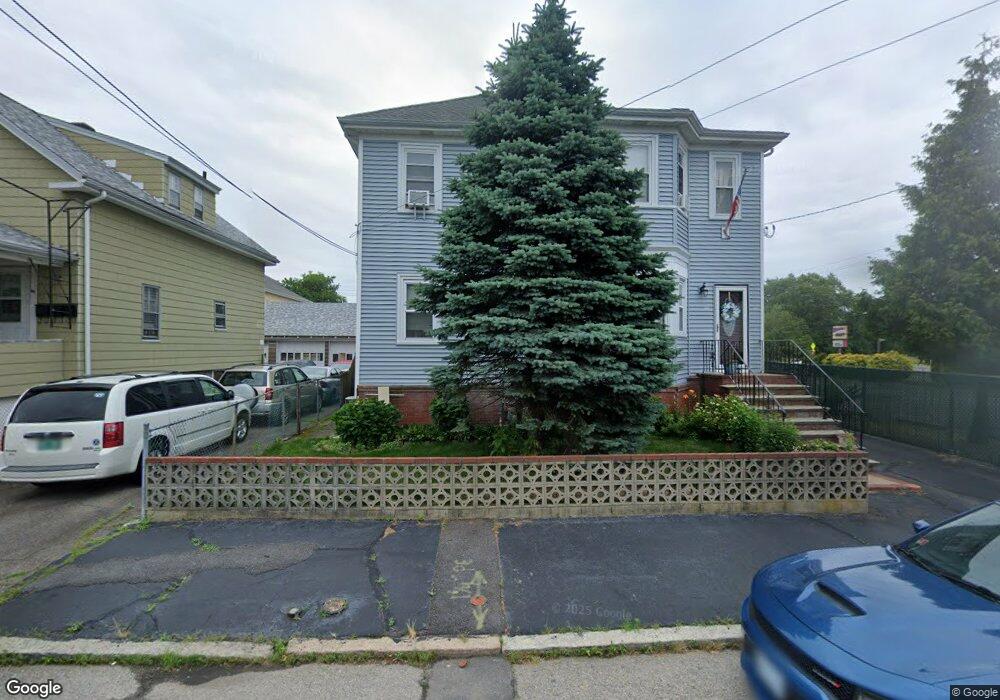
38 Ingraham St East Providence, RI 02914
Outer East Bay NeighborhoodEstimated Value: $459,743 - $549,000
6
Beds
2
Baths
2,830
Sq Ft
$180/Sq Ft
Est. Value
About This Home
This home is located at 38 Ingraham St, East Providence, RI 02914 and is currently estimated at $509,186, approximately $179 per square foot. 38 Ingraham St is a home located in Providence County with nearby schools including East Providence High School, Ocean State Montessori School, and The Gordon School.
Ownership History
Date
Name
Owned For
Owner Type
Purchase Details
Closed on
Jan 9, 2006
Sold by
Deoliveira Antonio and Deoliveira Garcia
Bought by
Vieira Jose E and Vieira Sandra
Current Estimated Value
Home Financials for this Owner
Home Financials are based on the most recent Mortgage that was taken out on this home.
Original Mortgage
$236,000
Outstanding Balance
$131,965
Interest Rate
6.28%
Mortgage Type
Purchase Money Mortgage
Estimated Equity
$377,221
Create a Home Valuation Report for This Property
The Home Valuation Report is an in-depth analysis detailing your home's value as well as a comparison with similar homes in the area
Home Values in the Area
Average Home Value in this Area
Purchase History
| Date | Buyer | Sale Price | Title Company |
|---|---|---|---|
| Vieira Jose E | $295,000 | -- | |
| Vieira Jose E | $295,000 | -- |
Source: Public Records
Mortgage History
| Date | Status | Borrower | Loan Amount |
|---|---|---|---|
| Open | Vieira Jose E | $236,000 | |
| Closed | Vieira Jose E | $59,000 | |
| Closed | Vieira Jose E | $236,000 |
Source: Public Records
Tax History Compared to Growth
Tax History
| Year | Tax Paid | Tax Assessment Tax Assessment Total Assessment is a certain percentage of the fair market value that is determined by local assessors to be the total taxable value of land and additions on the property. | Land | Improvement |
|---|---|---|---|---|
| 2025 | $6,424 | $491,500 | $84,200 | $407,300 |
| 2024 | $4,870 | $317,700 | $70,200 | $247,500 |
| 2023 | $4,689 | $317,700 | $70,200 | $247,500 |
| 2022 | $4,145 | $189,600 | $38,100 | $151,500 |
| 2021 | $4,076 | $189,600 | $36,700 | $152,900 |
| 2020 | $3,904 | $189,600 | $36,700 | $152,900 |
| 2019 | $3,796 | $189,600 | $36,700 | $152,900 |
| 2018 | $3,661 | $160,000 | $38,600 | $121,400 |
| 2017 | $3,579 | $160,000 | $38,600 | $121,400 |
| 2016 | $3,562 | $160,000 | $38,600 | $121,400 |
| 2015 | $3,759 | $163,800 | $47,600 | $116,200 |
| 2014 | $3,759 | $163,800 | $47,600 | $116,200 |
Source: Public Records
Map
Nearby Homes
- 78 Ingraham St
- 400 Juniper St Unit A
- 400 Juniper St Unit B
- 400 Juniper St Unit C
- 15 S Carpenter St
- 4 S Carpenter St
- 152 Freeborn Ave
- 109 Arlington St
- 18 Baker St Unit 20
- 108 Bliss St
- 109 Bliss St
- 320 Mauran Ave
- 17 Brown St Unit 19
- 51 7th St
- 93 Warren Ave
- 89 Warren Ave
- 74 Brookhaven Dr
- 132 S Rose St
- 9 Apulia St
- 91 Ivy St
- 34 Ingraham St
- 26 Ingraham St
- 37 Ingraham St
- 1015 S Broadway
- 33 Ingraham St
- 1019 S Broadway Unit 1021
- 25 Ingraham St
- 394 Mauran Ave
- 1018 S Broadway
- 1018 S Broadway Unit 1
- 1018 S Broadway Unit 2
- 19 Ingraham St
- 58 Ingraham St Unit 60
- 350 Mauran Ave
- 40 Fraser St
- 62 Ingraham St Unit 64
- 53 Ingraham St Unit 55
- 66 Ingraham St Unit 68
- 59 Ingraham St
- 1024 S Broadway