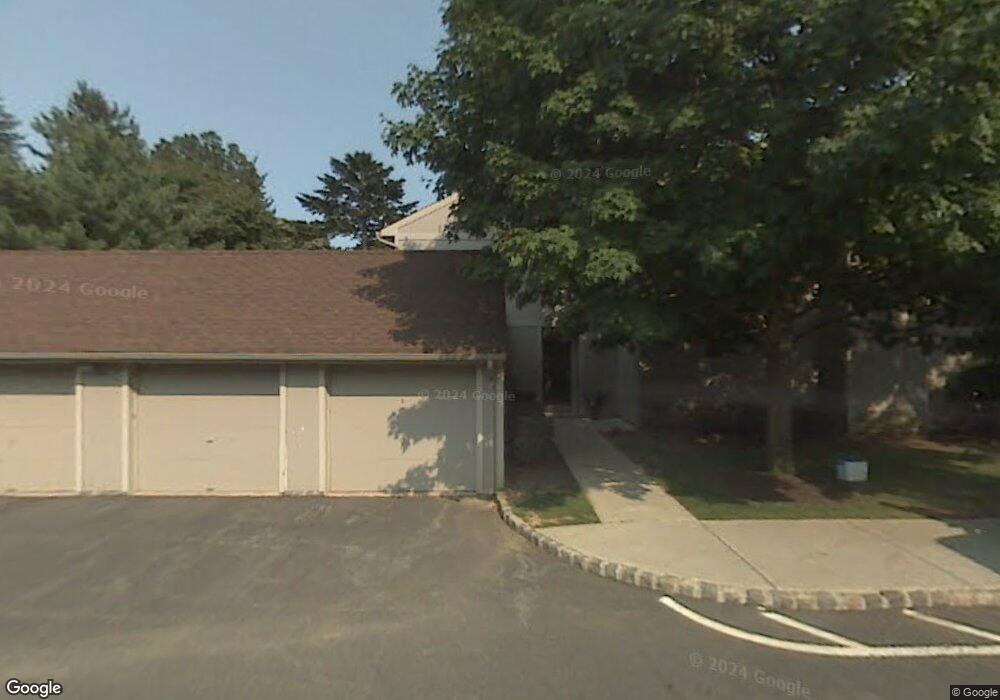
38 Irongate Metuchen, NJ 08840
Estimated Value: $694,477 - $804,000
3
Beds
3
Baths
1,956
Sq Ft
$387/Sq Ft
Est. Value
About This Home
This home is located at 38 Irongate, Metuchen, NJ 08840 and is currently estimated at $756,119, approximately $386 per square foot. 38 Irongate is a home located in Middlesex County with nearby schools including Campbell Elementary School, Edgar Middle School, and Metuchen High School.
Ownership History
Date
Name
Owned For
Owner Type
Purchase Details
Closed on
Jan 12, 2007
Sold by
Dejonge Bryan
Bought by
Petino Pter and Petino Joyce
Current Estimated Value
Purchase Details
Closed on
Nov 3, 1998
Sold by
Nolan Edward
Bought by
Dejonge Bryan and Dejonge Tracy
Home Financials for this Owner
Home Financials are based on the most recent Mortgage that was taken out on this home.
Original Mortgage
$162,000
Interest Rate
6.68%
Create a Home Valuation Report for This Property
The Home Valuation Report is an in-depth analysis detailing your home's value as well as a comparison with similar homes in the area
Home Values in the Area
Average Home Value in this Area
Purchase History
| Date | Buyer | Sale Price | Title Company |
|---|---|---|---|
| Petino Pter | $440,000 | -- | |
| Dejonge Bryan | $3,018,000 | -- |
Source: Public Records
Mortgage History
| Date | Status | Borrower | Loan Amount |
|---|---|---|---|
| Previous Owner | Dejonge Bryan | $162,000 |
Source: Public Records
Tax History Compared to Growth
Tax History
| Year | Tax Paid | Tax Assessment Tax Assessment Total Assessment is a certain percentage of the fair market value that is determined by local assessors to be the total taxable value of land and additions on the property. | Land | Improvement |
|---|---|---|---|---|
| 2025 | $11,622 | $167,100 | $60,000 | $107,100 |
| 2024 | $11,232 | $167,100 | $60,000 | $107,100 |
| 2023 | $11,232 | $167,100 | $60,000 | $107,100 |
| 2022 | $11,149 | $175,000 | $58,000 | $117,000 |
| 2021 | $10,434 | $175,000 | $58,000 | $117,000 |
| 2020 | $10,750 | $175,000 | $58,000 | $117,000 |
| 2019 | $10,434 | $175,000 | $58,000 | $117,000 |
| 2018 | $10,395 | $175,000 | $58,000 | $117,000 |
| 2017 | $10,217 | $175,000 | $58,000 | $117,000 |
| 2016 | $9,982 | $173,000 | $57,400 | $115,600 |
| 2015 | $9,761 | $173,000 | $57,400 | $115,600 |
| 2014 | $9,517 | $173,000 | $57,400 | $115,600 |
Source: Public Records
Map
Nearby Homes
- 25 Eileen Way
- 385 Pierson Ave
- 37 Garfield Park Unit B
- 212 Echo Ave
- 56 Homer Place
- 39 Rayle Ct
- 95 E Walnut St
- 162 Brower Ave
- 23 Montview Rd
- 84 Heman St
- 174 Alcoa Ave
- 191 Hoover Ave
- 35 Orchard St
- 103 Liddle Ave
- 81 Liddle Ave
- 99 Liddle Ave Unit B10
- 266 Middlesex Ave
- 28 Plymouth Place
- 951-953 Amboy Ave
- 951 953 Amboy Ave