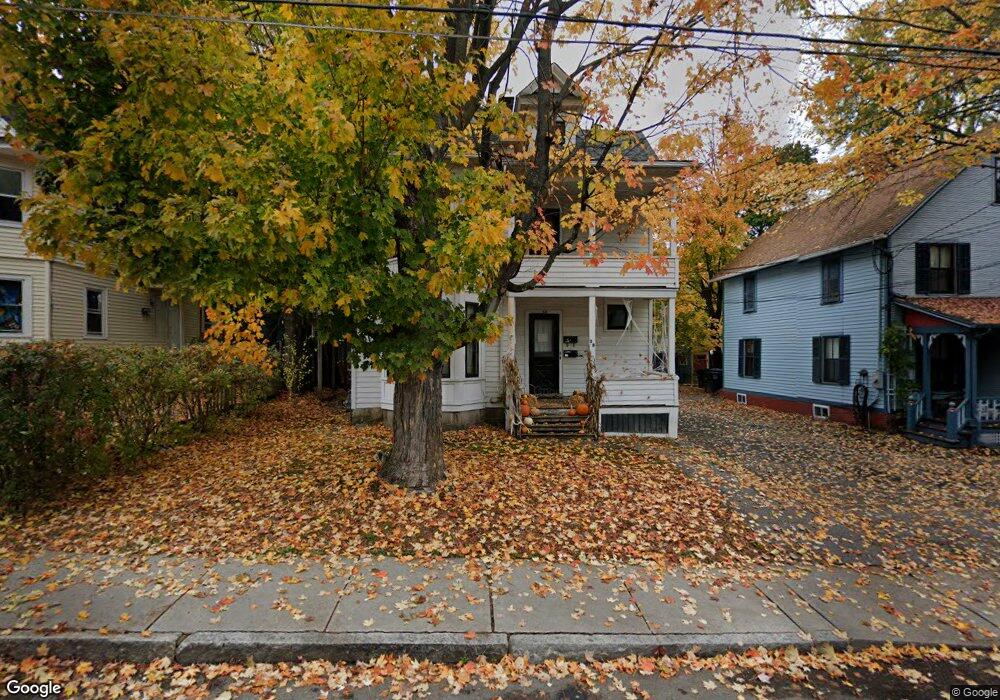
38 James St Torrington, CT 06790
Estimated Value: $284,717 - $353,000
3
Beds
2
Baths
2,264
Sq Ft
$147/Sq Ft
Est. Value
About This Home
This home is located at 38 James St, Torrington, CT 06790 and is currently estimated at $333,179, approximately $147 per square foot. 38 James St is a home located in Litchfield County with nearby schools including Torrington Middle School, Torrington High School, and St. John Paul the Great Academy.
Ownership History
Date
Name
Owned For
Owner Type
Purchase Details
Closed on
Nov 2, 2001
Sold by
Barth Robert L and Barth Camille A
Bought by
Ahmed Muhammed R and Ahmed Ayishatu T
Current Estimated Value
Home Financials for this Owner
Home Financials are based on the most recent Mortgage that was taken out on this home.
Original Mortgage
$145,100
Interest Rate
6.82%
Purchase Details
Closed on
Aug 6, 1992
Sold by
Demichiel Robert W and Demichiel June H
Bought by
Thompson Tod T and Torrence Julianne
Create a Home Valuation Report for This Property
The Home Valuation Report is an in-depth analysis detailing your home's value as well as a comparison with similar homes in the area
Home Values in the Area
Average Home Value in this Area
Purchase History
| Date | Buyer | Sale Price | Title Company |
|---|---|---|---|
| Ahmed Muhammed R | $147,500 | -- | |
| Thompson Tod T | $120,000 | -- |
Source: Public Records
Mortgage History
| Date | Status | Borrower | Loan Amount |
|---|---|---|---|
| Closed | Thompson Tod T | $100,000 | |
| Closed | Thompson Tod T | $100,000 | |
| Closed | Thompson Tod T | $145,100 | |
| Previous Owner | Thompson Tod T | $94,500 |
Source: Public Records
Tax History Compared to Growth
Tax History
| Year | Tax Paid | Tax Assessment Tax Assessment Total Assessment is a certain percentage of the fair market value that is determined by local assessors to be the total taxable value of land and additions on the property. | Land | Improvement |
|---|---|---|---|---|
| 2025 | $7,496 | $194,950 | $19,950 | $175,000 |
| 2024 | $4,112 | $85,720 | $19,950 | $65,770 |
| 2023 | $4,111 | $85,720 | $19,950 | $65,770 |
| 2022 | $4,041 | $85,720 | $19,950 | $65,770 |
| 2021 | $3,958 | $85,720 | $19,950 | $65,770 |
| 2020 | $3,958 | $85,720 | $19,950 | $65,770 |
| 2019 | $3,711 | $80,370 | $19,950 | $60,420 |
| 2018 | $3,711 | $80,370 | $19,950 | $60,420 |
| 2017 | $3,677 | $80,370 | $19,950 | $60,420 |
| 2016 | $3,677 | $80,370 | $19,950 | $60,420 |
| 2015 | $3,677 | $80,370 | $19,950 | $60,420 |
| 2014 | $3,719 | $102,390 | $25,480 | $76,910 |
Source: Public Records
Map
Nearby Homes
- 17 Prospect Place
- 482 Main St
- 00 Winthrop St & E Elm St
- 279 Main St
- 25 Lorenzo St
- 183 Brightwood Ave
- 7 George St
- 107 E Pearl St
- 25 Margerie St
- 146 Berry St
- 775 Main St
- 375 N Elm St
- 115 Margerie St
- 48 Brookside Ave
- 291 E Main St
- 96 Edward Ave
- 839 Main St Unit 65
- 839 Main St Unit 13
- 839 Main St Unit 91
- 839 Main St Unit 84