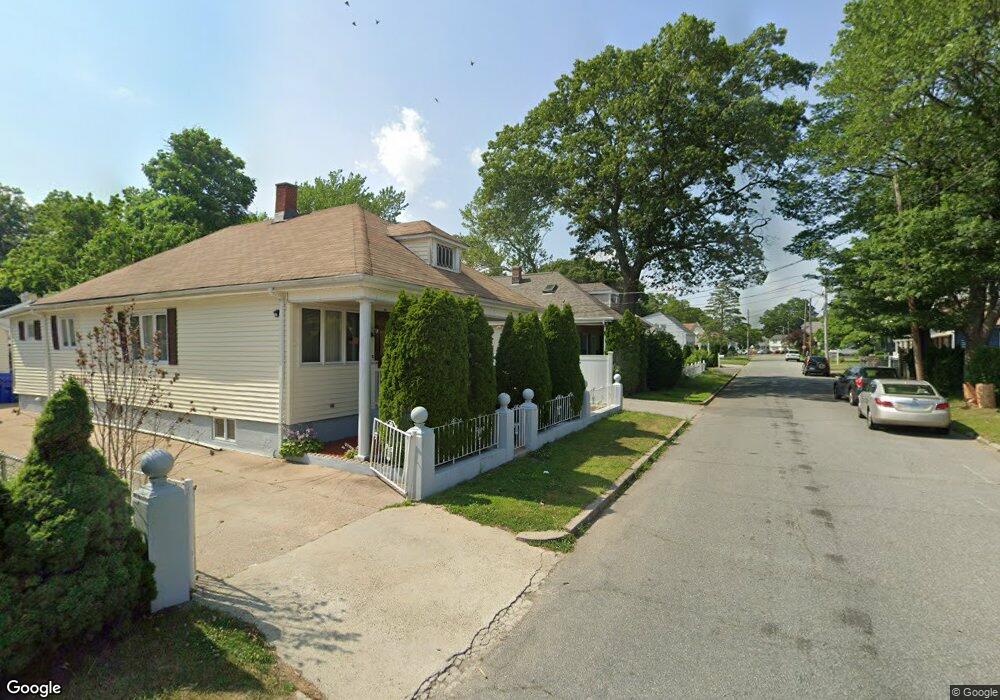
38 Jane St Pawtucket, RI 02860
Saylesville Highlands NeighborhoodEstimated Value: $369,863 - $402,000
3
Beds
1
Bath
1,249
Sq Ft
$314/Sq Ft
Est. Value
About This Home
This home is located at 38 Jane St, Pawtucket, RI 02860 and is currently estimated at $391,716, approximately $313 per square foot. 38 Jane St is a home located in Providence County with nearby schools including Lincoln Senior High School, Blackstone Valley Prep Upper Elementary School, and Blackstone Valley Prep Junior High School.
Ownership History
Date
Name
Owned For
Owner Type
Purchase Details
Closed on
Apr 26, 2005
Sold by
Booth Deborah A
Bought by
Dewolf Linda S
Current Estimated Value
Home Financials for this Owner
Home Financials are based on the most recent Mortgage that was taken out on this home.
Original Mortgage
$210,400
Outstanding Balance
$106,349
Interest Rate
5.87%
Mortgage Type
Purchase Money Mortgage
Estimated Equity
$285,367
Purchase Details
Closed on
May 24, 1989
Sold by
Chevrette Donald R
Bought by
Dame Deborah A
Create a Home Valuation Report for This Property
The Home Valuation Report is an in-depth analysis detailing your home's value as well as a comparison with similar homes in the area
Home Values in the Area
Average Home Value in this Area
Purchase History
| Date | Buyer | Sale Price | Title Company |
|---|---|---|---|
| Dewolf Linda S | $217,000 | -- | |
| Dame Deborah A | $106,000 | -- |
Source: Public Records
Mortgage History
| Date | Status | Borrower | Loan Amount |
|---|---|---|---|
| Open | Dame Deborah A | $25,000 | |
| Closed | Dame Deborah A | $16,063 | |
| Open | Dame Deborah A | $210,400 | |
| Previous Owner | Dame Deborah A | $92,859 |
Source: Public Records
Tax History
| Year | Tax Paid | Tax Assessment Tax Assessment Total Assessment is a certain percentage of the fair market value that is determined by local assessors to be the total taxable value of land and additions on the property. | Land | Improvement |
|---|---|---|---|---|
| 2025 | $3,753 | $285,400 | $128,700 | $156,700 |
| 2024 | $3,522 | $285,400 | $128,700 | $156,700 |
| 2023 | $3,312 | $195,500 | $70,100 | $125,400 |
| 2022 | $3,241 | $195,500 | $70,100 | $125,400 |
| 2021 | $3,241 | $195,500 | $70,100 | $125,400 |
| 2020 | $3,595 | $172,100 | $64,700 | $107,400 |
| 2019 | $3,595 | $172,100 | $64,700 | $107,400 |
| 2018 | $3,464 | $172,100 | $64,700 | $107,400 |
| 2017 | $3,190 | $140,400 | $59,400 | $81,000 |
| 2016 | $3,073 | $140,400 | $59,400 | $81,000 |
| 2015 | $3,073 | $140,400 | $59,400 | $81,000 |
| 2014 | $2,991 | $129,700 | $59,400 | $70,300 |
Source: Public Records
Map
Nearby Homes
- 16 Rufus St
- 121 Samuel Ave
- 53 Samuel Ave
- 584 Weeden St
- 8 Arnold Ave
- 18 Almy St
- 2 Cobble Hill Rd
- 53 Francis Ave
- 458 Smithfield Ave
- 53 Oriole Ave
- 26 Smith St
- 75 Larch St
- 220 Francis Ave
- 75 Baldwin St
- 546 Lonsdale Ave Unit 548
- 2 Ward Ave
- 616 Lonsdale Ave Unit 618
- 27 Lloyd St
- 60 Dorman Ave
- 101 Cobble Hill Rd
Your Personal Tour Guide
Ask me questions while you tour the home.