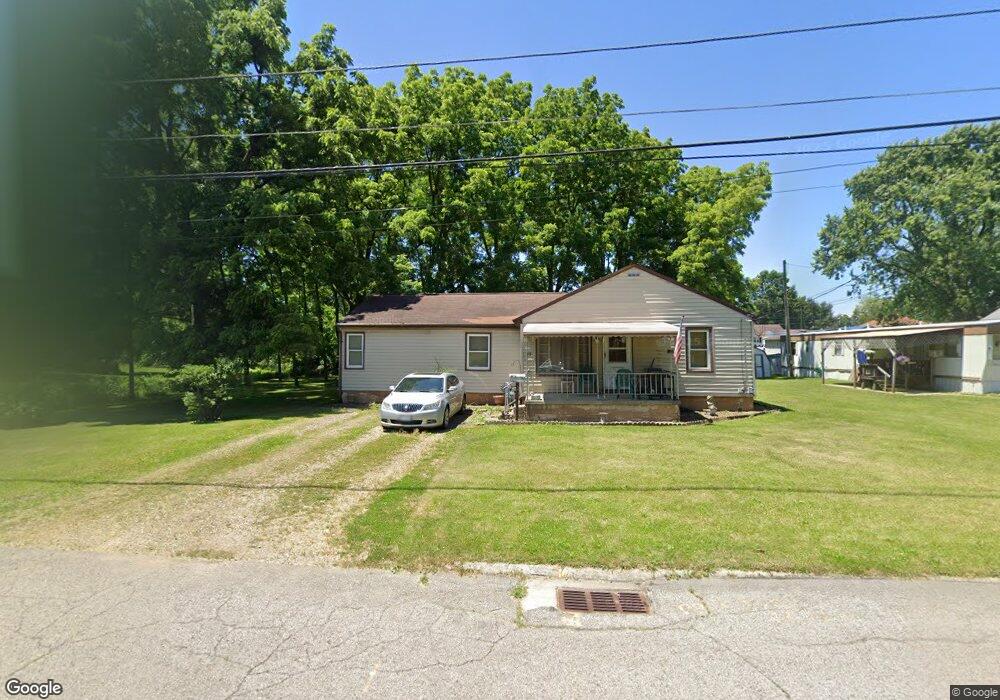
38 Jeffery Ave Shelby, OH 44875
Estimated Value: $116,771 - $161,000
3
Beds
1
Bath
1,326
Sq Ft
$102/Sq Ft
Est. Value
About This Home
This home is located at 38 Jeffery Ave, Shelby, OH 44875 and is currently estimated at $135,693, approximately $102 per square foot. 38 Jeffery Ave is a home located in Richland County with nearby schools including St. Mary's School.
Ownership History
Date
Name
Owned For
Owner Type
Purchase Details
Closed on
Feb 5, 2018
Sold by
Robinson Wanda E
Bought by
Robinson Timothy E and Robinson Tim E
Current Estimated Value
Home Financials for this Owner
Home Financials are based on the most recent Mortgage that was taken out on this home.
Original Mortgage
$55,000
Outstanding Balance
$47,706
Interest Rate
5%
Mortgage Type
Adjustable Rate Mortgage/ARM
Estimated Equity
$87,987
Purchase Details
Closed on
Jul 24, 1996
Sold by
Thomas James L
Bought by
Robinson Wanda E and Robinson Timothy E
Home Financials for this Owner
Home Financials are based on the most recent Mortgage that was taken out on this home.
Original Mortgage
$38,400
Interest Rate
6.75%
Mortgage Type
New Conventional
Create a Home Valuation Report for This Property
The Home Valuation Report is an in-depth analysis detailing your home's value as well as a comparison with similar homes in the area
Home Values in the Area
Average Home Value in this Area
Purchase History
| Date | Buyer | Sale Price | Title Company |
|---|---|---|---|
| Robinson Timothy E | -- | Acs Title | |
| Robinson Wanda E | $45,000 | -- |
Source: Public Records
Mortgage History
| Date | Status | Borrower | Loan Amount |
|---|---|---|---|
| Open | Robinson Timothy E | $55,000 | |
| Closed | Robinson Wanda E | $38,400 |
Source: Public Records
Tax History Compared to Growth
Tax History
| Year | Tax Paid | Tax Assessment Tax Assessment Total Assessment is a certain percentage of the fair market value that is determined by local assessors to be the total taxable value of land and additions on the property. | Land | Improvement |
|---|---|---|---|---|
| 2024 | $921 | $24,110 | $3,510 | $20,600 |
| 2023 | $921 | $24,110 | $3,510 | $20,600 |
| 2022 | $903 | $21,140 | $3,650 | $17,490 |
| 2021 | $904 | $21,140 | $3,650 | $17,490 |
| 2020 | $904 | $21,140 | $3,650 | $17,490 |
| 2019 | $829 | $17,780 | $3,070 | $14,710 |
| 2018 | $821 | $17,780 | $3,070 | $14,710 |
| 2017 | $813 | $17,780 | $3,070 | $14,710 |
| 2016 | $834 | $18,340 | $3,890 | $14,450 |
| 2015 | $829 | $18,340 | $3,890 | $14,450 |
| 2014 | $801 | $18,340 | $3,890 | $14,450 |
| 2012 | $415 | $19,310 | $4,100 | $15,210 |
Source: Public Records
Map
Nearby Homes