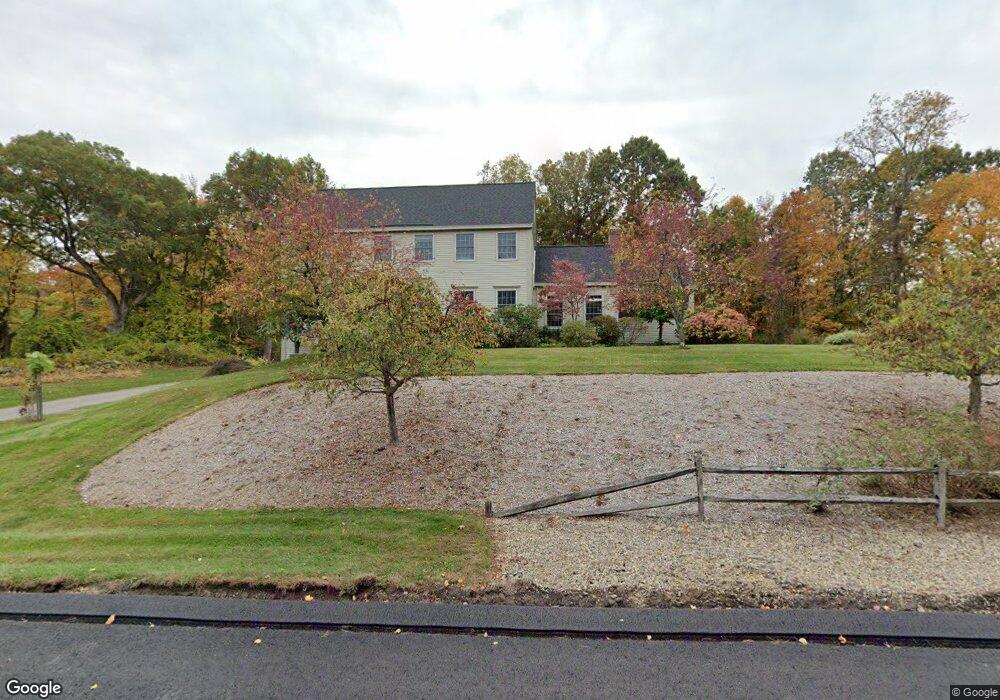
38 Joseph Rd Boxborough, MA 01719
Estimated Value: $945,000 - $1,100,000
3
Beds
3
Baths
2,536
Sq Ft
$402/Sq Ft
Est. Value
About This Home
This home is located at 38 Joseph Rd, Boxborough, MA 01719 and is currently estimated at $1,018,456, approximately $401 per square foot. 38 Joseph Rd is a home located in Middlesex County with nearby schools including Acton-Boxborough Regional High School.
Ownership History
Date
Name
Owned For
Owner Type
Purchase Details
Closed on
Oct 2, 2025
Sold by
Faranda Diana L and Faranda Robert T
Bought by
Faranda Int and Faranda F
Current Estimated Value
Purchase Details
Closed on
Oct 30, 1996
Sold by
Northwest Structures
Bought by
Faranda Robert T and Faranda Diana L
Home Financials for this Owner
Home Financials are based on the most recent Mortgage that was taken out on this home.
Original Mortgage
$172,000
Interest Rate
8.07%
Mortgage Type
Purchase Money Mortgage
Create a Home Valuation Report for This Property
The Home Valuation Report is an in-depth analysis detailing your home's value as well as a comparison with similar homes in the area
Home Values in the Area
Average Home Value in this Area
Purchase History
| Date | Buyer | Sale Price | Title Company |
|---|---|---|---|
| Faranda Int | -- | -- | |
| Faranda Robert T | $357,500 | -- | |
| Faranda Robert T | $357,500 | -- |
Source: Public Records
Mortgage History
| Date | Status | Borrower | Loan Amount |
|---|---|---|---|
| Previous Owner | Faranda Robert T | $171,000 | |
| Previous Owner | Faranda Robert T | $171,000 | |
| Previous Owner | Faranda Robert T | $172,000 |
Source: Public Records
Tax History Compared to Growth
Tax History
| Year | Tax Paid | Tax Assessment Tax Assessment Total Assessment is a certain percentage of the fair market value that is determined by local assessors to be the total taxable value of land and additions on the property. | Land | Improvement |
|---|---|---|---|---|
| 2025 | $14,375 | $949,500 | $294,500 | $655,000 |
| 2024 | $13,281 | $886,000 | $283,000 | $603,000 |
| 2023 | $12,956 | $834,800 | $255,000 | $579,800 |
| 2022 | $12,356 | $709,300 | $255,000 | $454,300 |
| 2020 | $5,668 | $666,400 | $255,000 | $411,400 |
| 2019 | $10,942 | $666,400 | $255,000 | $411,400 |
| 2018 | $12,709 | $629,300 | $243,000 | $386,300 |
| 2017 | $10,336 | $614,900 | $244,500 | $370,400 |
| 2016 | $9,800 | $599,000 | $244,500 | $354,500 |
| 2015 | $9,867 | $592,600 | $244,100 | $348,500 |
| 2014 | $9,921 | $560,800 | $241,600 | $319,200 |
Source: Public Records
Map
Nearby Homes
- 777 Depot Rd
- 134 Russet Ln
- 68 Macintosh Ln
- 96 Cedarwood Rd
- 139 Picnic St
- 31 Mohawk Dr
- 5 Elm St Unit 1
- 9 Elm St Unit 1
- 63 Leonard Rd Unit 63
- 4 Huron Rd
- 285 Central St Unit 285
- Lot 2 Strawberry Farm
- 1155 Burroughs Rd
- 92 Willow St Unit 3
- 92 Willow St Unit 2
- 89 Windsor Ave
- 90 Willow St Unit 1
- 12 Olde Lantern Rd
- 4 Omega Way
- 58 Spencer Rd Unit 18K
- 35 Joseph Rd
- 65 Joseph Rd
- 10 Joseph Rd
- 448 Liberty Square Rd
- 536 Liberty Square Rd
- 446 Liberty Square Rd
- 93 Joseph Rd
- 560 Liberty Square Rd
- 550 Liberty Square Rd
- 105 Joseph Rd
- 618 Depot Rd
- 646 Depot Rd
- 451 Sargent Rd
- 600 Depot Rd
- 136 Joseph Rd
- 632 Depot Rd
- 431 Sargent Rd
- 668 Depot Rd
- 586 Depot Rd
- 429 Liberty Square Rd