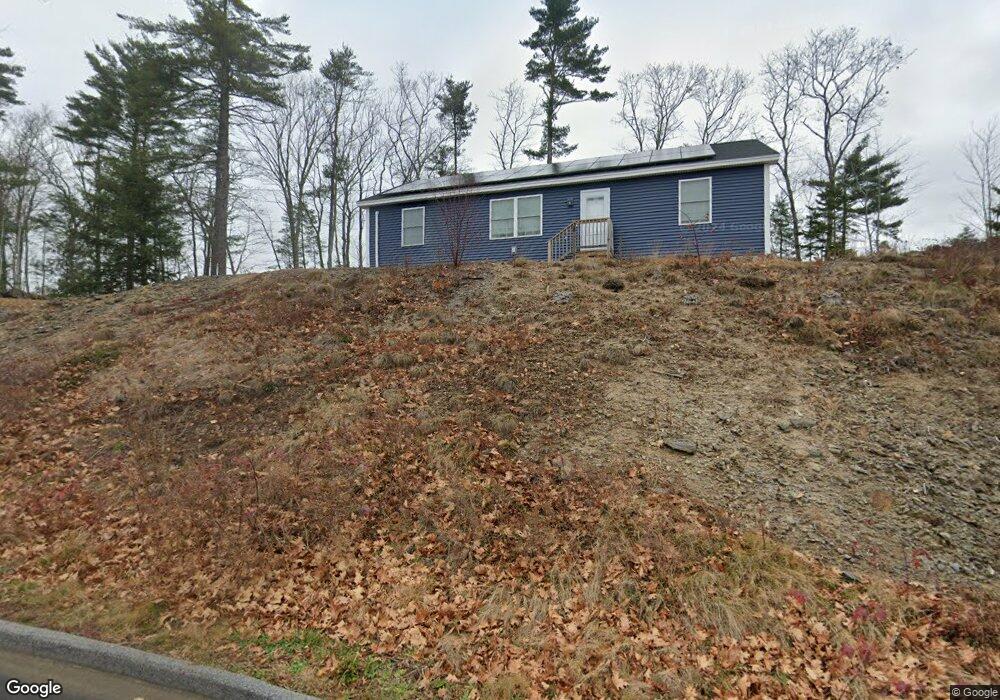
38 Juniper St Old Orchard Beach, ME 04064
Estimated Value: $471,000 - $626,000
2
Beds
2
Baths
1,344
Sq Ft
$405/Sq Ft
Est. Value
About This Home
This home is located at 38 Juniper St, Old Orchard Beach, ME 04064 and is currently estimated at $544,267, approximately $404 per square foot. 38 Juniper St is a home with nearby schools including Jameson Elementary School, Loranger Memorial School, and Old Orchard Beach High School.
Ownership History
Date
Name
Owned For
Owner Type
Purchase Details
Closed on
Jul 10, 2020
Sold by
Rjt Construction Inc
Bought by
Miles Jessica L
Current Estimated Value
Home Financials for this Owner
Home Financials are based on the most recent Mortgage that was taken out on this home.
Original Mortgage
$261,657
Outstanding Balance
$232,020
Interest Rate
3.1%
Mortgage Type
New Conventional
Estimated Equity
$312,247
Purchase Details
Closed on
Jan 31, 2020
Sold by
Hp Developers Llc
Bought by
Vacation Properties Inc
Purchase Details
Closed on
Sep 11, 2019
Sold by
Hp Developers Llc
Bought by
Rjt Construction Inc
Home Financials for this Owner
Home Financials are based on the most recent Mortgage that was taken out on this home.
Original Mortgage
$177,520
Interest Rate
3.7%
Mortgage Type
New Conventional
Create a Home Valuation Report for This Property
The Home Valuation Report is an in-depth analysis detailing your home's value as well as a comparison with similar homes in the area
Home Values in the Area
Average Home Value in this Area
Purchase History
| Date | Buyer | Sale Price | Title Company |
|---|---|---|---|
| Miles Jessica L | -- | None Available | |
| Vacation Properties Inc | -- | None Available | |
| Rjt Construction Inc | -- | -- |
Source: Public Records
Mortgage History
| Date | Status | Borrower | Loan Amount |
|---|---|---|---|
| Open | Miles Jessica L | $261,657 | |
| Previous Owner | Rjt Construction Inc | $177,520 |
Source: Public Records
Tax History Compared to Growth
Tax History
| Year | Tax Paid | Tax Assessment Tax Assessment Total Assessment is a certain percentage of the fair market value that is determined by local assessors to be the total taxable value of land and additions on the property. | Land | Improvement |
|---|---|---|---|---|
| 2024 | $4,647 | $427,100 | $134,100 | $293,000 |
| 2023 | $4,359 | $382,400 | $125,000 | $257,400 |
| 2022 | $4,316 | $352,600 | $113,600 | $239,000 |
| 2021 | $4,145 | $292,700 | $103,300 | $189,400 |
| 2020 | $2,936 | $190,400 | $81,000 | $109,400 |
| 2019 | $2,692 | $173,700 | $90,500 | $83,200 |
| 2018 | $1,181 | $77,200 | $77,200 | $0 |
| 2017 | $236 | $15,000 | $15,000 | $0 |
| 2016 | $226 | $14,600 | $14,600 | $0 |
| 2015 | $222 | $14,600 | $14,600 | $0 |
| 2014 | $217 | $14,600 | $14,600 | $0 |
| 2013 | $144 | $10,400 | $10,400 | $0 |
Source: Public Records
Map
Nearby Homes
- Lot 3-5 Juniper St
- 25 Juniper St
- 404-3-3 Juniper St
- 36 Dolphin Ave
- 2 Poplar St
- 2 Lindas Way
- 20 Red Oak Dr Unit 2
- 26 Red Oak Dr Unit 5
- 16 Red Oak Dr
- 49 Red Oak Dr
- 21 Red Oak Dr
- 51 Red Oak Dr
- 14 Red Oak Dr
- 13 Red Oak Dr
- 15 Red Oak Dr
- 47 Red Oak Dr
- 12 Red Oak Dr
- 17 Red Oak Dr
- 45 Red Oak Dr
- 19 Red Oak Dr