M
Seller's Agent in 2026
Michelle Walker
Coldwell Banker Realty - Easton
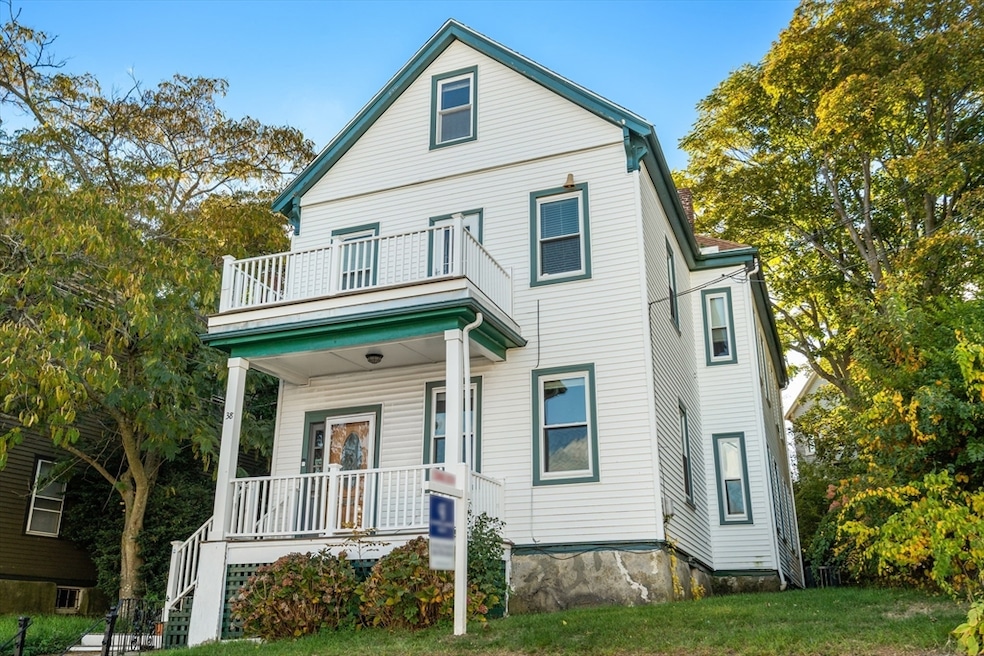
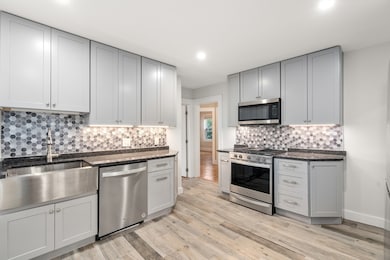

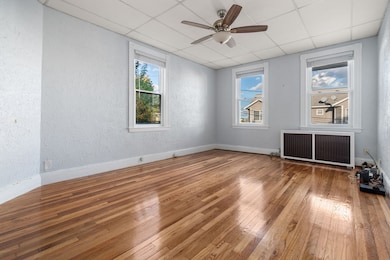

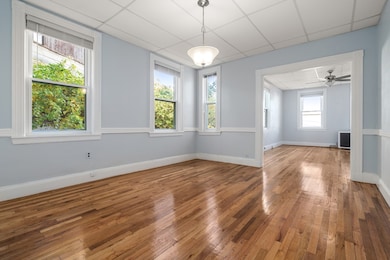

Welcome to Fort Hill in Roxbury, where classic Boston architecture meets modern comfort. Come see this beautifully maintained two-family home that blends historic detail with modern updates. Inside you'll find hardwood floors, newer windows, and modern kitchens and bathrooms. The third floor walk up space offers three rooms with city skyline views, ready for expansion. Perfect for an owner-occupant or investor, 38 Juniper St. combines location, space, and flexibility rarely found in the city.
Last Agent to Sell the Property
Michelle Walker
Coldwell Banker Realty - Easton Listed on: 10/28/2025
| Date | Type | Sale Price | Title Company |
|---|---|---|---|
| Quit Claim Deed | $1,030,000 | -- | |
| Quit Claim Deed | -- | None Available | |
| Deed | $34,500 | -- | |
| Foreclosure Deed | $149,085 | -- |
| Date | Status | Loan Amount | Loan Type |
|---|---|---|---|
| Open | $1,011,344 | New Conventional | |
| Previous Owner | $32,750 | Purchase Money Mortgage | |
| Previous Owner | $115,000 | No Value Available |
| Date | Event | Price | List to Sale | Price per Sq Ft |
|---|---|---|---|---|
| 01/12/2026 01/12/26 | Sold | $1,030,000 | -1.9% | $303 / Sq Ft |
| 11/19/2025 11/19/25 | Pending | -- | -- | -- |
| 10/28/2025 10/28/25 | For Sale | $1,050,000 | -- | $309 / Sq Ft |
| Year | Tax Paid | Tax Assessment Tax Assessment Total Assessment is a certain percentage of the fair market value that is determined by local assessors to be the total taxable value of land and additions on the property. | Land | Improvement |
|---|---|---|---|---|
| 2025 | $9,056 | $782,000 | $328,000 | $454,000 |
| 2024 | $8,794 | $806,800 | $247,100 | $559,700 |
| 2023 | $8,332 | $775,800 | $237,600 | $538,200 |
| 2022 | $7,674 | $705,300 | $216,000 | $489,300 |
| 2021 | $7,034 | $659,200 | $201,900 | $457,300 |
| 2020 | $6,395 | $605,600 | $177,700 | $427,900 |
| 2019 | $5,967 | $566,100 | $136,000 | $430,100 |
| 2018 | $5,496 | $524,400 | $136,000 | $388,400 |
| 2017 | $5,499 | $519,300 | $136,000 | $383,300 |
| 2016 | $4,284 | $389,424 | $114,240 | $275,184 |
| 2015 | $3,885 | $320,800 | $105,200 | $215,600 |
| 2014 | $3,544 | $281,700 | $105,200 | $176,500 |
M
Seller's Agent in 2026
Michelle Walker
Coldwell Banker Realty - Easton

Buyer's Agent in 2026
George Sarkis
Douglas Elliman Real Estate - The Sarkis Team
(781) 603-8702
2 in this area
676 Total Sales
Source: MLS Property Information Network (MLS PIN)
MLS Number: 73448662
APN: ROXB-000000-000009-003745
Disclaimer: Certain information contained herein is derived from information provided by parties other than Homes.com. All information provided is deemed reliable, but is not guaranteed to be accurate and should be independently verified.
![]() The property listing data and information, or the Images, set forth herein were provided to MLS Property Information Network, Inc. from third party sources, including sellers, lessors and public records, and were compiled by MLS Property Information Network, Inc. The property listing data and information, and the Images, are for the personal, non-commercial use of consumers having a good faith interest in purchasing or leasing listed properties of the type displayed to them and may not be used for any purpose other than to identify prospective properties which such consumers may have a good faith interest in purchasing or leasing. MLS Property Information Network, Inc. and its subscribers disclaim any and all representations and warranties as to the accuracy of the property listing data and information, or as to the accuracy of any of the Images, set forth herein.
The property listing data and information, or the Images, set forth herein were provided to MLS Property Information Network, Inc. from third party sources, including sellers, lessors and public records, and were compiled by MLS Property Information Network, Inc. The property listing data and information, and the Images, are for the personal, non-commercial use of consumers having a good faith interest in purchasing or leasing listed properties of the type displayed to them and may not be used for any purpose other than to identify prospective properties which such consumers may have a good faith interest in purchasing or leasing. MLS Property Information Network, Inc. and its subscribers disclaim any and all representations and warranties as to the accuracy of the property listing data and information, or as to the accuracy of any of the Images, set forth herein.
Ask me questions while you tour the home.