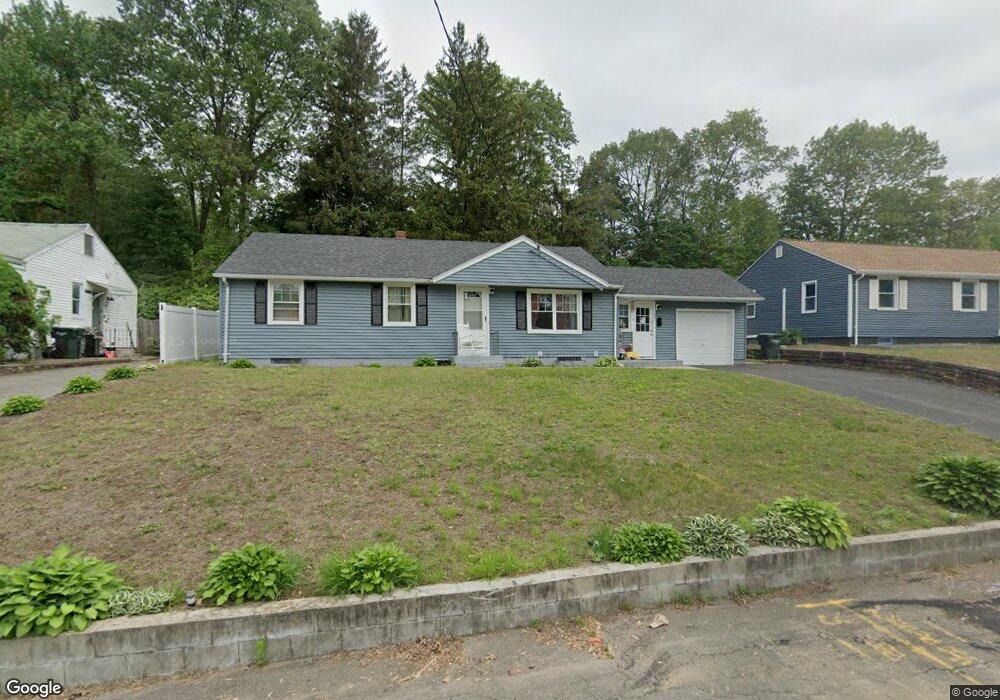
38 Kay St Springfield, MA 01109
Pine Point NeighborhoodEstimated Value: $286,410 - $347,000
3
Beds
2
Baths
1,140
Sq Ft
$272/Sq Ft
Est. Value
About This Home
This home is located at 38 Kay St, Springfield, MA 01109 and is currently estimated at $310,103, approximately $272 per square foot. 38 Kay St is a home located in Hampden County with nearby schools including Frank H. Freedman School, John J Duggan Middle, and Springfield Central High School.
Ownership History
Date
Name
Owned For
Owner Type
Purchase Details
Closed on
Aug 4, 2009
Sold by
Blake Elizabeth A
Bought by
Barnett Yvonne
Current Estimated Value
Home Financials for this Owner
Home Financials are based on the most recent Mortgage that was taken out on this home.
Original Mortgage
$115,995
Outstanding Balance
$76,474
Interest Rate
5.43%
Mortgage Type
Purchase Money Mortgage
Estimated Equity
$233,629
Purchase Details
Closed on
Jun 30, 2004
Sold by
Lundrigan Sandra and Camerota Theresa
Bought by
Blake Elizabeth A
Home Financials for this Owner
Home Financials are based on the most recent Mortgage that was taken out on this home.
Original Mortgage
$124,870
Interest Rate
6.3%
Mortgage Type
Purchase Money Mortgage
Purchase Details
Closed on
Sep 4, 2003
Sold by
Camerota Frank and Camerota Theresa
Bought by
Lundrigan Sandra and Camerota Theresa
Create a Home Valuation Report for This Property
The Home Valuation Report is an in-depth analysis detailing your home's value as well as a comparison with similar homes in the area
Home Values in the Area
Average Home Value in this Area
Purchase History
| Date | Buyer | Sale Price | Title Company |
|---|---|---|---|
| Barnett Yvonne | $146,000 | -- | |
| Blake Elizabeth A | $129,500 | -- | |
| Lundrigan Sandra | -- | -- |
Source: Public Records
Mortgage History
| Date | Status | Borrower | Loan Amount |
|---|---|---|---|
| Open | Barnett Yvonne | $115,995 | |
| Previous Owner | Blake Elizabeth A | $124,870 | |
| Previous Owner | Blake Elizabeth A | $2,500 | |
| Previous Owner | Blake Elizabeth A | $2,590 |
Source: Public Records
Tax History
| Year | Tax Paid | Tax Assessment Tax Assessment Total Assessment is a certain percentage of the fair market value that is determined by local assessors to be the total taxable value of land and additions on the property. | Land | Improvement |
|---|---|---|---|---|
| 2025 | $4,103 | $261,700 | $40,800 | $220,900 |
| 2024 | $3,644 | $226,900 | $34,000 | $192,900 |
| 2023 | $3,330 | $195,300 | $30,900 | $164,400 |
| 2022 | $3,086 | $164,000 | $28,900 | $135,100 |
| 2021 | $2,805 | $148,400 | $26,300 | $122,100 |
| 2020 | $2,920 | $149,500 | $26,300 | $123,200 |
| 2019 | $2,787 | $141,600 | $26,300 | $115,300 |
| 2018 | $2,594 | $131,800 | $26,300 | $105,500 |
| 2017 | $2,499 | $127,100 | $24,300 | $102,800 |
| 2016 | $2,367 | $120,400 | $24,300 | $96,100 |
| 2015 | $2,292 | $116,500 | $24,300 | $92,200 |
Source: Public Records
Map
Nearby Homes
Your Personal Tour Guide
Ask me questions while you tour the home.