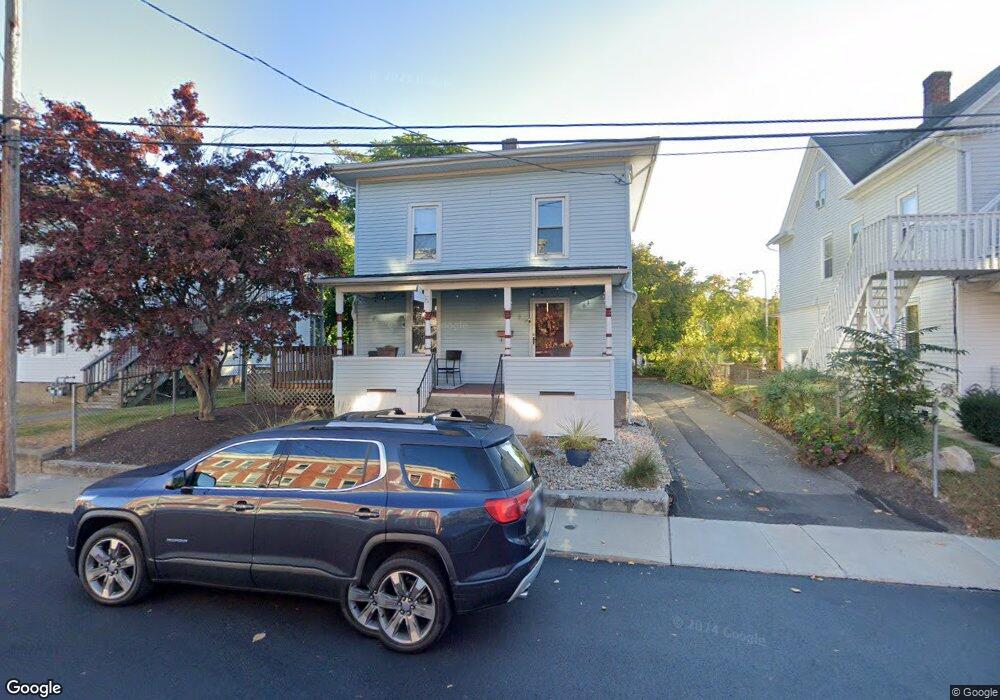
38 Kelley St Bristol, CT 06010
Downtown Bristol NeighborhoodEstimated Value: $237,000 - $330,000
4
Beds
2
Baths
1,248
Sq Ft
$228/Sq Ft
Est. Value
About This Home
This home is located at 38 Kelley St, Bristol, CT 06010 and is currently estimated at $284,822, approximately $228 per square foot. 38 Kelley St is a home located in Hartford County with nearby schools including West Bristol Sch, Bristol Central High School, and Immanuel Lutheran School.
Ownership History
Date
Name
Owned For
Owner Type
Purchase Details
Closed on
Oct 15, 1996
Sold by
Sowamco 20 Ltd
Bought by
Skovran Helen P
Current Estimated Value
Purchase Details
Closed on
Jul 23, 1990
Sold by
Burns Daniel
Bought by
Wheeler Frank
Home Financials for this Owner
Home Financials are based on the most recent Mortgage that was taken out on this home.
Original Mortgage
$111,200
Interest Rate
9.94%
Purchase Details
Closed on
Jun 5, 1989
Sold by
The M H Clark Trust
Bought by
Burns Daniel T
Home Financials for this Owner
Home Financials are based on the most recent Mortgage that was taken out on this home.
Original Mortgage
$100,000
Interest Rate
10.92%
Create a Home Valuation Report for This Property
The Home Valuation Report is an in-depth analysis detailing your home's value as well as a comparison with similar homes in the area
Home Values in the Area
Average Home Value in this Area
Purchase History
| Date | Buyer | Sale Price | Title Company |
|---|---|---|---|
| Skovran Helen P | $44,000 | -- | |
| Wheeler Frank | $139,000 | -- | |
| Burns Daniel T | $70,000 | -- |
Source: Public Records
Mortgage History
| Date | Status | Borrower | Loan Amount |
|---|---|---|---|
| Previous Owner | Burns Daniel T | $111,200 | |
| Previous Owner | Burns Daniel T | $100,000 |
Source: Public Records
Tax History Compared to Growth
Tax History
| Year | Tax Paid | Tax Assessment Tax Assessment Total Assessment is a certain percentage of the fair market value that is determined by local assessors to be the total taxable value of land and additions on the property. | Land | Improvement |
|---|---|---|---|---|
| 2025 | $3,556 | $105,350 | $24,360 | $80,990 |
| 2024 | $3,355 | $105,350 | $24,360 | $80,990 |
| 2023 | $3,197 | $105,350 | $24,360 | $80,990 |
| 2022 | $2,480 | $64,680 | $13,860 | $50,820 |
| 2021 | $2,480 | $64,680 | $13,860 | $50,820 |
| 2020 | $2,480 | $64,680 | $13,860 | $50,820 |
| 2019 | $2,461 | $64,680 | $13,860 | $50,820 |
| 2018 | $2,385 | $64,680 | $13,860 | $50,820 |
| 2017 | $2,512 | $69,720 | $26,320 | $43,400 |
| 2016 | $2,512 | $69,720 | $26,320 | $43,400 |
| 2015 | $2,413 | $69,720 | $26,320 | $43,400 |
| 2014 | $2,413 | $69,720 | $26,320 | $43,400 |
Source: Public Records
Map
Nearby Homes