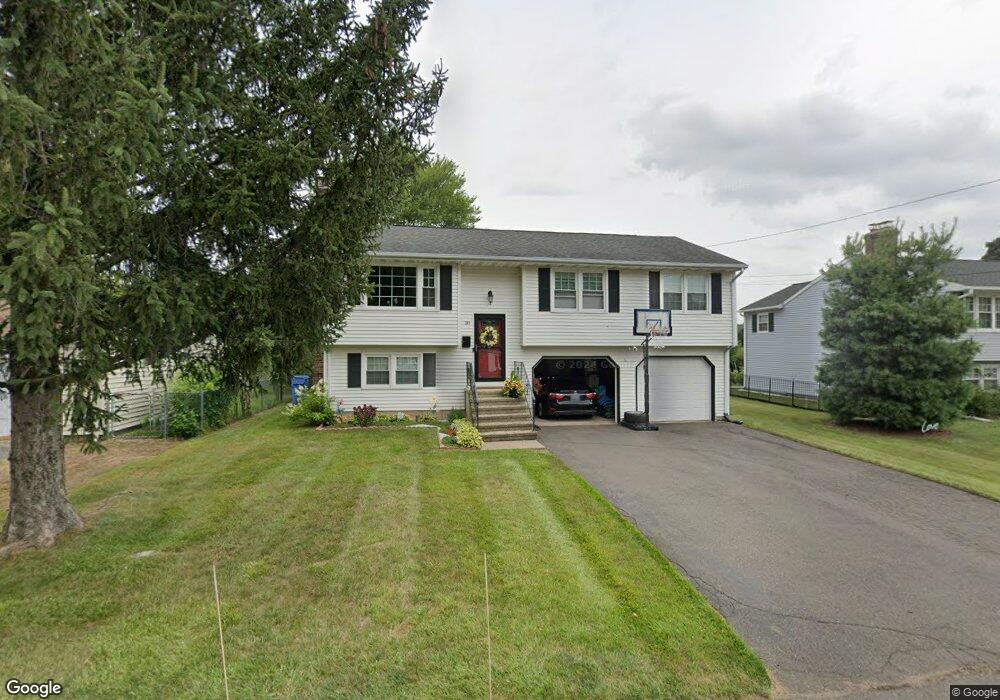
38 Kulper Rd New Britain, CT 06051
Estimated Value: $287,348 - $414,000
3
Beds
2
Baths
1,566
Sq Ft
$211/Sq Ft
Est. Value
About This Home
This home is located at 38 Kulper Rd, New Britain, CT 06051 and is currently estimated at $330,087, approximately $210 per square foot. 38 Kulper Rd is a home located in Hartford County with nearby schools including Smith School, Slade Middle School, and St Paul School.
Ownership History
Date
Name
Owned For
Owner Type
Purchase Details
Closed on
Oct 31, 2005
Sold by
Edwards Rory T
Bought by
Stewart Sheila M
Current Estimated Value
Home Financials for this Owner
Home Financials are based on the most recent Mortgage that was taken out on this home.
Original Mortgage
$144,800
Outstanding Balance
$78,122
Interest Rate
5.79%
Estimated Equity
$251,965
Purchase Details
Closed on
Jul 21, 1992
Sold by
Crowley Brian J
Bought by
Edwards Rory T and Edwards Nina K
Home Financials for this Owner
Home Financials are based on the most recent Mortgage that was taken out on this home.
Original Mortgage
$131,625
Interest Rate
8.5%
Mortgage Type
Unknown
Create a Home Valuation Report for This Property
The Home Valuation Report is an in-depth analysis detailing your home's value as well as a comparison with similar homes in the area
Home Values in the Area
Average Home Value in this Area
Purchase History
| Date | Buyer | Sale Price | Title Company |
|---|---|---|---|
| Stewart Sheila M | $181,000 | -- | |
| Edwards Rory T | $127,000 | -- |
Source: Public Records
Mortgage History
| Date | Status | Borrower | Loan Amount |
|---|---|---|---|
| Open | Edwards Rory T | $144,800 | |
| Closed | Edwards Rory T | $27,150 | |
| Previous Owner | Edwards Rory T | $125,800 | |
| Previous Owner | Edwards Rory T | $131,625 |
Source: Public Records
Tax History
| Year | Tax Paid | Tax Assessment Tax Assessment Total Assessment is a certain percentage of the fair market value that is determined by local assessors to be the total taxable value of land and additions on the property. | Land | Improvement |
|---|---|---|---|---|
| 2025 | $5,858 | $149,520 | $42,210 | $107,310 |
| 2024 | $5,919 | $149,520 | $42,210 | $107,310 |
| 2023 | $5,724 | $149,520 | $42,210 | $107,310 |
| 2022 | $5,274 | $106,540 | $19,460 | $87,080 |
| 2021 | $5,274 | $106,540 | $19,460 | $87,080 |
| 2020 | $5,380 | $106,540 | $19,460 | $87,080 |
| 2019 | $5,380 | $106,540 | $19,460 | $87,080 |
| 2018 | $5,380 | $106,540 | $19,460 | $87,080 |
| 2017 | $5,126 | $101,500 | $19,460 | $82,040 |
| 2016 | $5,126 | $101,500 | $19,460 | $82,040 |
| 2015 | $4,974 | $101,500 | $19,460 | $82,040 |
| 2014 | $4,974 | $101,500 | $19,460 | $82,040 |
Source: Public Records
Map
Nearby Homes
Your Personal Tour Guide
Ask me questions while you tour the home.