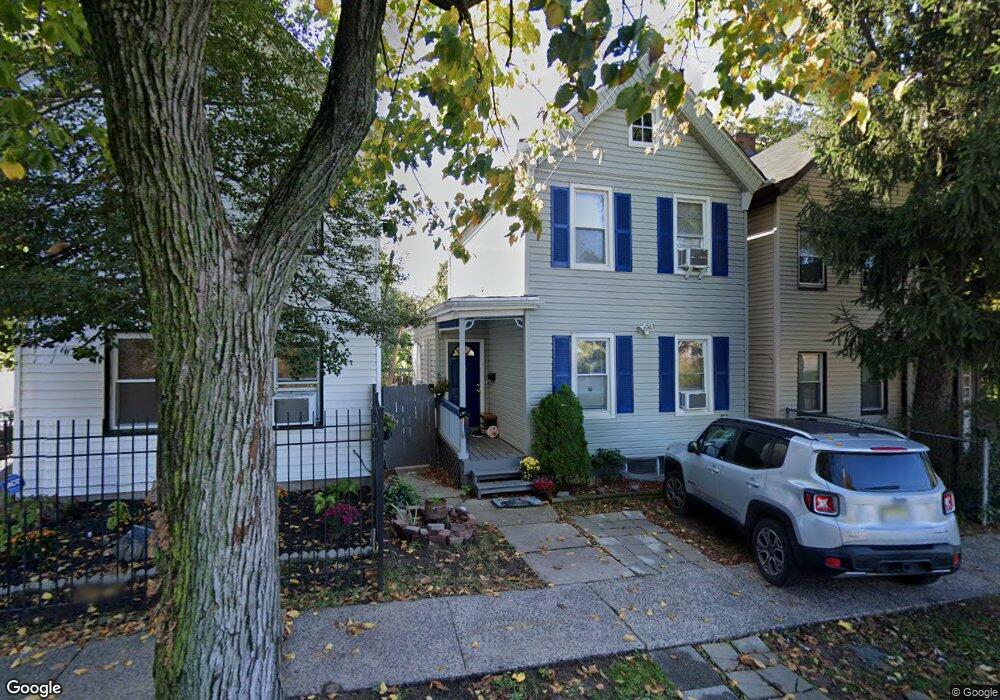
38 Lake St East Orange, NJ 07017
Estimated Value: $362,000 - $487,000
--
Bed
--
Bath
1,190
Sq Ft
$340/Sq Ft
Est. Value
About This Home
This home is located at 38 Lake St, East Orange, NJ 07017 and is currently estimated at $404,597, approximately $339 per square foot. 38 Lake St is a home located in Essex County with nearby schools including Johnnie L. Cochran Junior Academy Elementary School, John L Costley Middle School, and Patrick F Healy Middle School.
Ownership History
Date
Name
Owned For
Owner Type
Purchase Details
Closed on
Nov 29, 2005
Sold by
Harrison Dorothea
Bought by
Massenburg Lee
Current Estimated Value
Home Financials for this Owner
Home Financials are based on the most recent Mortgage that was taken out on this home.
Original Mortgage
$40,000
Outstanding Balance
$22,447
Interest Rate
6.34%
Mortgage Type
Stand Alone Second
Estimated Equity
$382,150
Create a Home Valuation Report for This Property
The Home Valuation Report is an in-depth analysis detailing your home's value as well as a comparison with similar homes in the area
Home Values in the Area
Average Home Value in this Area
Purchase History
| Date | Buyer | Sale Price | Title Company |
|---|---|---|---|
| Massenburg Lee | $200,000 | -- |
Source: Public Records
Mortgage History
| Date | Status | Borrower | Loan Amount |
|---|---|---|---|
| Open | Massenburg Lee | $40,000 | |
| Open | Massenburg Lee | $160,000 |
Source: Public Records
Tax History Compared to Growth
Tax History
| Year | Tax Paid | Tax Assessment Tax Assessment Total Assessment is a certain percentage of the fair market value that is determined by local assessors to be the total taxable value of land and additions on the property. | Land | Improvement |
|---|---|---|---|---|
| 2025 | $7,280 | $237,700 | $82,200 | $155,500 |
| 2024 | $7,280 | $237,700 | $82,200 | $155,500 |
| 2022 | $6,658 | $237,700 | $82,200 | $155,500 |
| 2021 | $6,383 | $119,700 | $58,600 | $61,100 |
| 2020 | $6,298 | $119,700 | $58,600 | $61,100 |
| 2019 | $6,214 | $119,700 | $58,600 | $61,100 |
| 2018 | $6,134 | $119,700 | $58,600 | $61,100 |
| 2017 | $5,955 | $119,700 | $58,600 | $61,100 |
| 2016 | $5,858 | $119,700 | $58,600 | $61,100 |
| 2015 | $5,709 | $119,700 | $58,600 | $61,100 |
| 2014 | $5,625 | $119,700 | $58,600 | $61,100 |
Source: Public Records
Map
Nearby Homes