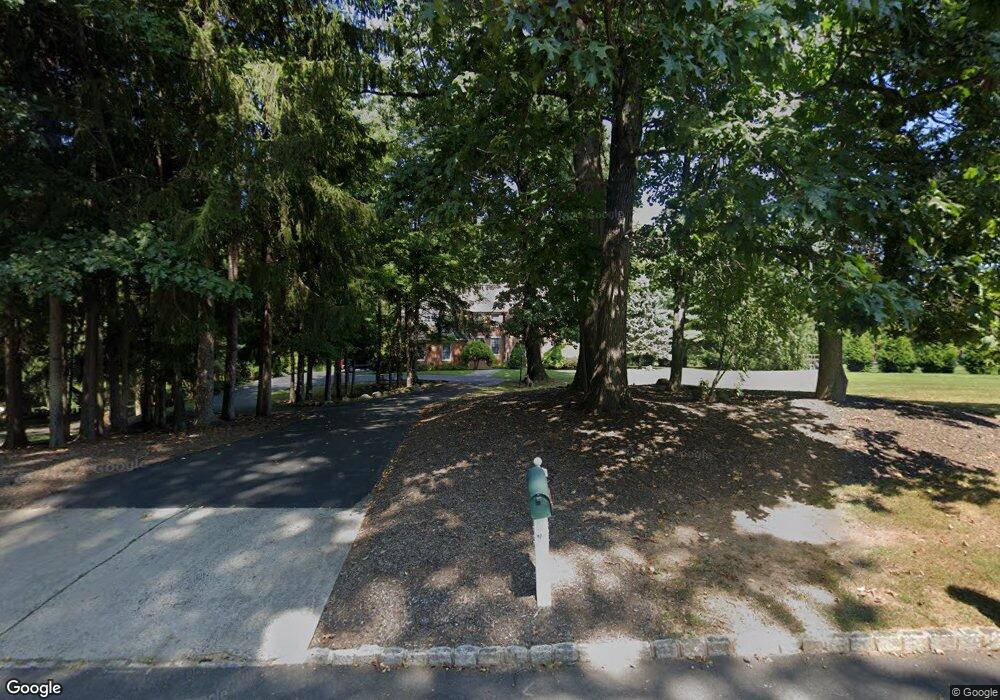
38 Lance Rd Lebanon, NJ 08833
Readington NeighborhoodEstimated Value: $1,136,000 - $1,329,202
--
Bed
--
Bath
5,486
Sq Ft
$230/Sq Ft
Est. Value
About This Home
This home is located at 38 Lance Rd, Lebanon, NJ 08833 and is currently estimated at $1,259,551, approximately $229 per square foot. 38 Lance Rd is a home located in Hunterdon County with nearby schools including Hunterdon Central Regional High School District.
Ownership History
Date
Name
Owned For
Owner Type
Purchase Details
Closed on
Mar 24, 2002
Sold by
Casas Gabriel
Bought by
Aportela Andres and Aportela Aida
Current Estimated Value
Home Financials for this Owner
Home Financials are based on the most recent Mortgage that was taken out on this home.
Original Mortgage
$450,000
Outstanding Balance
$185,065
Interest Rate
6.84%
Estimated Equity
$1,074,486
Purchase Details
Closed on
May 11, 2000
Sold by
Daffron Thomas
Bought by
Casas Gabriel and Casas Karen
Home Financials for this Owner
Home Financials are based on the most recent Mortgage that was taken out on this home.
Original Mortgage
$350,000
Interest Rate
8.12%
Purchase Details
Closed on
Sep 28, 1995
Sold by
Manors At Oldwyck Llc
Bought by
Daffron Thomas and Daffron Mara G
Create a Home Valuation Report for This Property
The Home Valuation Report is an in-depth analysis detailing your home's value as well as a comparison with similar homes in the area
Home Values in the Area
Average Home Value in this Area
Purchase History
| Date | Buyer | Sale Price | Title Company |
|---|---|---|---|
| Aportela Andres | $699,000 | -- | |
| Casas Gabriel | $652,000 | -- | |
| Daffron Thomas | $410,000 | -- |
Source: Public Records
Mortgage History
| Date | Status | Borrower | Loan Amount |
|---|---|---|---|
| Open | Aportela Andres | $450,000 | |
| Previous Owner | Casas Gabriel | $350,000 |
Source: Public Records
Tax History Compared to Growth
Tax History
| Year | Tax Paid | Tax Assessment Tax Assessment Total Assessment is a certain percentage of the fair market value that is determined by local assessors to be the total taxable value of land and additions on the property. | Land | Improvement |
|---|---|---|---|---|
| 2025 | $22,499 | $858,400 | $204,000 | $654,400 |
| 2024 | $22,310 | $858,400 | $204,000 | $654,400 |
| 2023 | $22,310 | $858,400 | $204,000 | $654,400 |
| 2022 | $21,735 | $858,400 | $204,000 | $654,400 |
| 2021 | $21,012 | $858,400 | $204,000 | $654,400 |
| 2020 | $21,421 | $704,400 | $133,500 | $570,900 |
| 2019 | $21,012 | $704,400 | $133,500 | $570,900 |
| 2018 | $20,681 | $704,400 | $133,500 | $570,900 |
| 2017 | $20,202 | $704,400 | $133,500 | $570,900 |
| 2016 | $19,723 | $704,400 | $133,500 | $570,900 |
| 2015 | $19,406 | $704,400 | $133,500 | $570,900 |
| 2014 | $19,167 | $704,400 | $133,500 | $570,900 |
Source: Public Records
Map
Nearby Homes