38 Lane Ct Unit 38 Old Bridge, NJ 08857
Estimated Value: $261,139 - $344,000
1
Bed
1
Bath
793
Sq Ft
$378/Sq Ft
Est. Value
About This Home
This home is located at 38 Lane Ct Unit 38, Old Bridge, NJ 08857 and is currently estimated at $300,035, approximately $378 per square foot. 38 Lane Ct Unit 38 is a home located in Middlesex County with nearby schools including Old Bridge High School, St. Ambrose School, and Minding Miracles Learning Center.
Ownership History
Date
Name
Owned For
Owner Type
Purchase Details
Closed on
Oct 21, 2009
Sold by
Morrow Brian K
Bought by
Dutz Gregory
Current Estimated Value
Home Financials for this Owner
Home Financials are based on the most recent Mortgage that was taken out on this home.
Original Mortgage
$159,065
Outstanding Balance
$103,761
Interest Rate
5.06%
Mortgage Type
FHA
Estimated Equity
$196,274
Create a Home Valuation Report for This Property
The Home Valuation Report is an in-depth analysis detailing your home's value as well as a comparison with similar homes in the area
Home Values in the Area
Average Home Value in this Area
Purchase History
| Date | Buyer | Sale Price | Title Company |
|---|---|---|---|
| Dutz Gregory | $162,000 | Multiple |
Source: Public Records
Mortgage History
| Date | Status | Borrower | Loan Amount |
|---|---|---|---|
| Open | Dutz Gregory | $159,065 |
Source: Public Records
Tax History Compared to Growth
Tax History
| Year | Tax Paid | Tax Assessment Tax Assessment Total Assessment is a certain percentage of the fair market value that is determined by local assessors to be the total taxable value of land and additions on the property. | Land | Improvement |
|---|---|---|---|---|
| 2025 | $3,771 | $65,600 | $21,000 | $44,600 |
| 2024 | $3,622 | $65,600 | $21,000 | $44,600 |
| 2023 | $3,622 | $65,600 | $21,000 | $44,600 |
| 2022 | $3,510 | $65,600 | $21,000 | $44,600 |
| 2021 | $2,579 | $65,600 | $21,000 | $44,600 |
| 2020 | $3,411 | $65,600 | $21,000 | $44,600 |
| 2019 | $3,358 | $65,600 | $21,000 | $44,600 |
| 2018 | $3,317 | $65,600 | $21,000 | $44,600 |
| 2017 | $3,216 | $65,600 | $21,000 | $44,600 |
| 2016 | $3,150 | $65,600 | $21,000 | $44,600 |
| 2015 | $3,097 | $65,600 | $21,000 | $44,600 |
| 2014 | $3,065 | $65,600 | $21,000 | $44,600 |
Source: Public Records
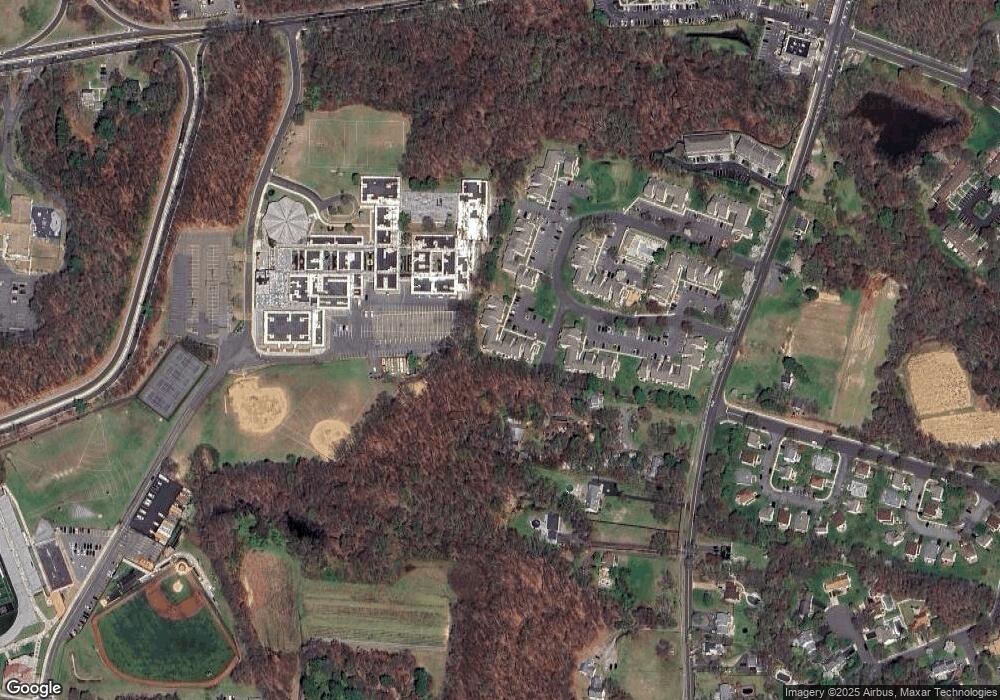
Map
Nearby Homes