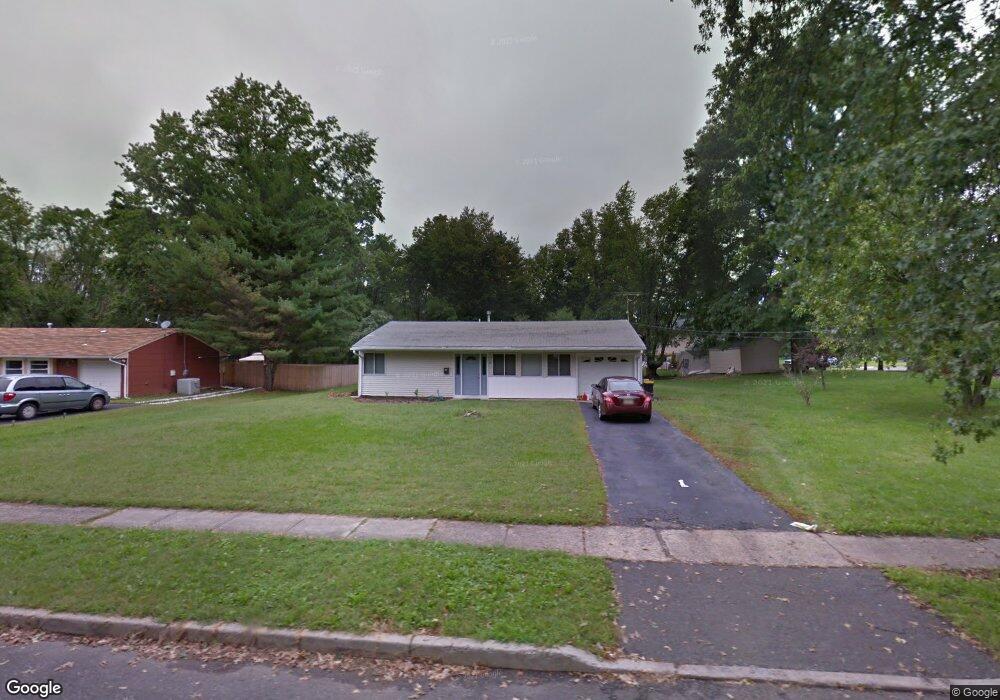
38 Langley Rd Kendall Park, NJ 08824
Estimated Value: $498,000 - $552,000
4
Beds
2
Baths
1,318
Sq Ft
$406/Sq Ft
Est. Value
About This Home
This home is located at 38 Langley Rd, Kendall Park, NJ 08824 and is currently estimated at $534,981, approximately $405 per square foot. 38 Langley Rd is a home located in Middlesex County with nearby schools including Greenbrook Elementary School, Crossroads South Middle School, and South Brunswick High School.
Ownership History
Date
Name
Owned For
Owner Type
Purchase Details
Closed on
Feb 26, 2019
Sold by
Kumar Neeraj
Bought by
Aurellado Bernard L and Regala Aurellado Rowena
Current Estimated Value
Home Financials for this Owner
Home Financials are based on the most recent Mortgage that was taken out on this home.
Original Mortgage
$336,385
Outstanding Balance
$295,560
Interest Rate
4.37%
Mortgage Type
FHA
Estimated Equity
$239,421
Purchase Details
Closed on
Jan 26, 2018
Sold by
Olsen Jenna and Jonse Earl
Bought by
Kumar Neeraj
Home Financials for this Owner
Home Financials are based on the most recent Mortgage that was taken out on this home.
Original Mortgage
$191,250
Interest Rate
4.32%
Mortgage Type
New Conventional
Purchase Details
Closed on
Dec 5, 2007
Sold by
Reid Patricia
Bought by
Olsen Jenna and Jones Earl
Home Financials for this Owner
Home Financials are based on the most recent Mortgage that was taken out on this home.
Original Mortgage
$286,000
Interest Rate
6.27%
Mortgage Type
Purchase Money Mortgage
Create a Home Valuation Report for This Property
The Home Valuation Report is an in-depth analysis detailing your home's value as well as a comparison with similar homes in the area
Home Values in the Area
Average Home Value in this Area
Purchase History
| Date | Buyer | Sale Price | Title Company |
|---|---|---|---|
| Aurellado Bernard L | $348,000 | None Available | |
| Kumar Neeraj | $255,000 | None Available | |
| Olsen Jenna | $286,000 | First American Title Ins Co |
Source: Public Records
Mortgage History
| Date | Status | Borrower | Loan Amount |
|---|---|---|---|
| Open | Aurellado Bernard L | $336,385 | |
| Previous Owner | Kumar Neeraj | $191,250 | |
| Previous Owner | Olsen Jenna | $286,000 |
Source: Public Records
Tax History Compared to Growth
Tax History
| Year | Tax Paid | Tax Assessment Tax Assessment Total Assessment is a certain percentage of the fair market value that is determined by local assessors to be the total taxable value of land and additions on the property. | Land | Improvement |
|---|---|---|---|---|
| 2025 | $7,930 | $150,200 | $75,800 | $74,400 |
| 2024 | $7,588 | $150,200 | $75,800 | $74,400 |
| 2023 | $7,588 | $149,300 | $75,800 | $73,500 |
| 2022 | $7,358 | $149,300 | $75,800 | $73,500 |
| 2021 | $5,727 | $149,300 | $75,800 | $73,500 |
| 2020 | $7,650 | $149,300 | $75,800 | $73,500 |
| 2019 | $7,717 | $149,300 | $75,800 | $73,500 |
| 2018 | $7,085 | $141,700 | $75,800 | $65,900 |
| 2017 | $7,074 | $141,700 | $75,800 | $65,900 |
| 2016 | $6,999 | $141,700 | $75,800 | $65,900 |
| 2015 | $6,786 | $141,700 | $75,800 | $65,900 |
| 2014 | $6,677 | $141,700 | $75,800 | $65,900 |
Source: Public Records
Map
Nearby Homes
- 36 Langley Rd
- 45 Stillwell Rd
- 45 Stillwell Rd Unit na
- 43 Stillwell Rd
- 39 Langley Rd
- 37 Langley Rd
- 34 Langley Rd
- 41 Stillwell Rd
- 41 Langley Rd
- 33 Langley Rd
- 49 Stillwell Rd
- 44 Stillwell Rd
- 39 Stillwell Rd
- 48 Stillwell Rd
- 2 Woodbine Rd
- 30 Langley Rd
- 29 Langley Rd
- 51 Stillwell Rd
- 37 Stillwell Rd
- 5 Woodbine Rd