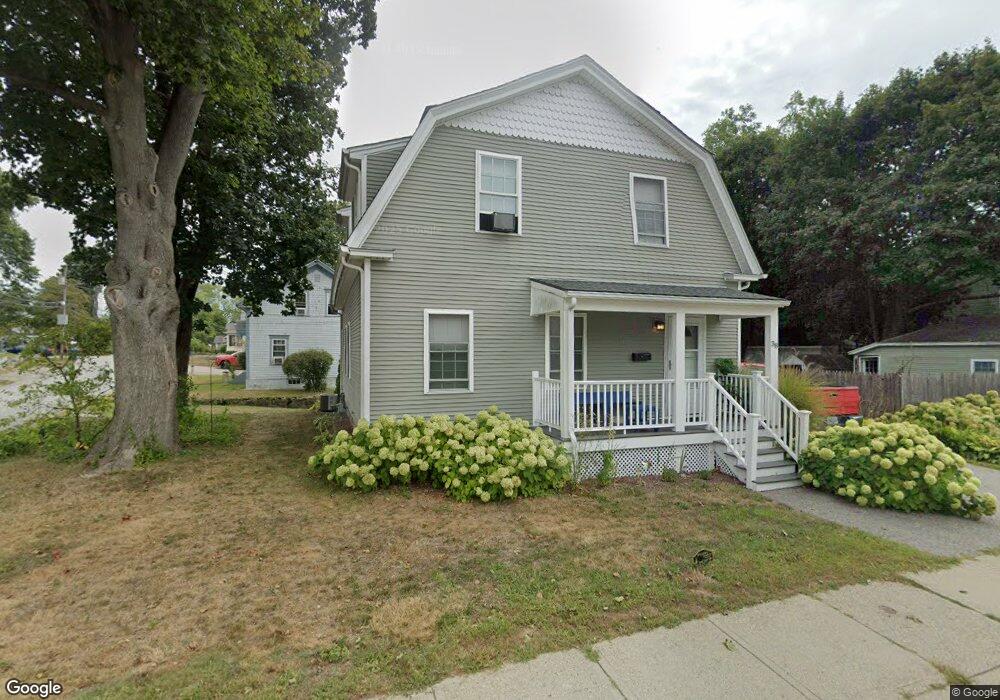
38 Laurel Ave Coventry, RI 02816
Estimated Value: $422,065 - $458,000
4
Beds
3
Baths
1,732
Sq Ft
$254/Sq Ft
Est. Value
About This Home
This home is located at 38 Laurel Ave, Coventry, RI 02816 and is currently estimated at $440,516, approximately $254 per square foot. 38 Laurel Ave is a home located in Kent County with nearby schools including Alan Shawn Feinstein Ms Of Cov, Coventry High School, and Father John V. Doyle School.
Ownership History
Date
Name
Owned For
Owner Type
Purchase Details
Closed on
Jun 4, 2013
Sold by
Barker Joshua A and Hoxsie Jillian L
Bought by
Barker Joshua A and Barker Jillian H
Current Estimated Value
Purchase Details
Closed on
Dec 22, 2011
Sold by
Colaluca John
Bought by
Barker Joshua A and Hoxsie Jillian L
Home Financials for this Owner
Home Financials are based on the most recent Mortgage that was taken out on this home.
Original Mortgage
$165,000
Interest Rate
3.99%
Mortgage Type
Purchase Money Mortgage
Purchase Details
Closed on
Oct 15, 2010
Sold by
Curran Thomas H and Curran Donna M
Bought by
Colaluca John
Create a Home Valuation Report for This Property
The Home Valuation Report is an in-depth analysis detailing your home's value as well as a comparison with similar homes in the area
Purchase History
| Date | Buyer | Sale Price | Title Company |
|---|---|---|---|
| Barker Joshua A | -- | -- | |
| Barker Joshua A | $165,000 | -- | |
| Colaluca John | $65,000 | -- |
Source: Public Records
Mortgage History
| Date | Status | Borrower | Loan Amount |
|---|---|---|---|
| Open | Colaluca John | $144,650 | |
| Previous Owner | Colaluca John | $165,000 |
Source: Public Records
Tax History
| Year | Tax Paid | Tax Assessment Tax Assessment Total Assessment is a certain percentage of the fair market value that is determined by local assessors to be the total taxable value of land and additions on the property. | Land | Improvement |
|---|---|---|---|---|
| 2025 | $4,858 | $301,900 | $90,500 | $211,400 |
| 2024 | $4,782 | $301,900 | $90,500 | $211,400 |
| 2023 | $4,628 | $301,900 | $90,500 | $211,400 |
| 2022 | $4,869 | $248,800 | $87,000 | $161,800 |
| 2021 | $4,827 | $248,800 | $87,000 | $161,800 |
| 2020 | $5,533 | $248,800 | $87,000 | $161,800 |
| 2019 | $4,306 | $193,600 | $73,000 | $120,600 |
| 2018 | $4,184 | $193,600 | $73,000 | $120,600 |
| 2017 | $4,062 | $193,600 | $73,000 | $120,600 |
| 2016 | $3,772 | $176,200 | $55,100 | $121,100 |
| 2015 | $3,670 | $176,200 | $55,100 | $121,100 |
| 2014 | $3,594 | $176,200 | $55,100 | $121,100 |
| 2013 | $3,032 | $162,500 | $59,400 | $103,100 |
Source: Public Records
Map
Nearby Homes
- 27 Matteson St
- 32 Pilgrim Ave
- 12 Hazard St
- 513 Washington St
- 505 Washington St
- 31 Anthony St Unit 33
- 123 Doolittle St
- 91 Windsor Park Dr
- 58 Read Ave
- 15 Hope Ct
- 168 Knotty Oak Rd
- 0 Beaulieu Ave
- 1 Pettine St
- 9 Regent St Unit 11
- 37 Phillip St
- 37 West St
- 37 Holden St
- 16 Morris St
- 33-35 Holden St
- 22 Wood St
Your Personal Tour Guide
Ask me questions while you tour the home.