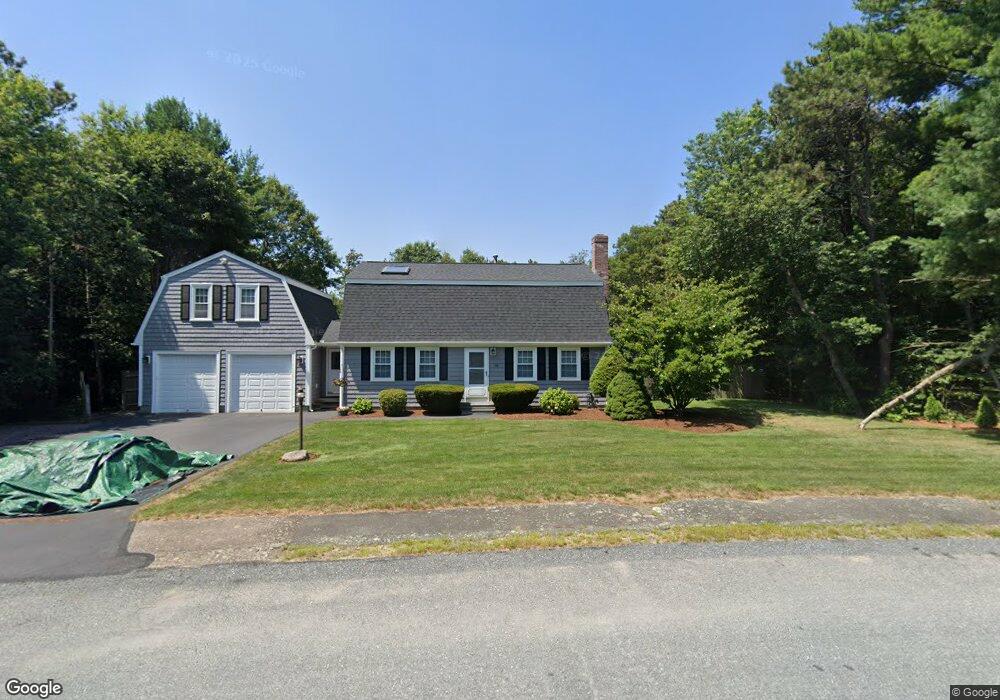
38 Lawrence Rd Plymouth, MA 02360
Estimated Value: $706,000 - $760,446
3
Beds
3
Baths
2,292
Sq Ft
$317/Sq Ft
Est. Value
About This Home
This home is located at 38 Lawrence Rd, Plymouth, MA 02360 and is currently estimated at $727,362, approximately $317 per square foot. 38 Lawrence Rd is a home located in Plymouth County with nearby schools including Federal Furnace Elementary School, Plymouth Community Intermediate, and Plymouth North High School.
Ownership History
Date
Name
Owned For
Owner Type
Purchase Details
Closed on
Feb 10, 2015
Sold by
Cavanaugh Michael P and Cavanaugh Marlene K
Bought by
Cavanaugh Marlene K and Cavanaugh Michael P
Current Estimated Value
Home Financials for this Owner
Home Financials are based on the most recent Mortgage that was taken out on this home.
Original Mortgage
$125,000
Outstanding Balance
$96,023
Interest Rate
3.84%
Mortgage Type
New Conventional
Estimated Equity
$631,339
Purchase Details
Closed on
Jul 21, 2006
Sold by
Coady Kenneth M and Coady Lynn M
Bought by
Cavanaugh Michael P and Cavanaugh Marlene K
Home Financials for this Owner
Home Financials are based on the most recent Mortgage that was taken out on this home.
Original Mortgage
$225,000
Interest Rate
6.67%
Mortgage Type
Purchase Money Mortgage
Purchase Details
Closed on
Oct 21, 1988
Sold by
Mcdonough Coleman
Bought by
Coady Kenneth M
Create a Home Valuation Report for This Property
The Home Valuation Report is an in-depth analysis detailing your home's value as well as a comparison with similar homes in the area
Home Values in the Area
Average Home Value in this Area
Purchase History
| Date | Buyer | Sale Price | Title Company |
|---|---|---|---|
| Cavanaugh Marlene K | -- | -- | |
| Cavanaugh Michael P | $430,000 | -- | |
| Coady Kenneth M | $146,000 | -- |
Source: Public Records
Mortgage History
| Date | Status | Borrower | Loan Amount |
|---|---|---|---|
| Open | Cavanaugh Marlene K | $125,000 | |
| Previous Owner | Coady Kenneth M | $225,000 | |
| Previous Owner | Coady Kenneth M | $75,000 |
Source: Public Records
Tax History Compared to Growth
Tax History
| Year | Tax Paid | Tax Assessment Tax Assessment Total Assessment is a certain percentage of the fair market value that is determined by local assessors to be the total taxable value of land and additions on the property. | Land | Improvement |
|---|---|---|---|---|
| 2025 | $8,002 | $630,600 | $261,800 | $368,800 |
| 2024 | $7,578 | $588,800 | $248,600 | $340,200 |
| 2023 | $7,512 | $547,900 | $226,600 | $321,300 |
| 2022 | $6,783 | $439,600 | $204,500 | $235,100 |
| 2021 | $6,580 | $407,200 | $204,500 | $202,700 |
| 2020 | $6,450 | $394,500 | $193,500 | $201,000 |
| 2019 | $6,193 | $374,400 | $171,500 | $202,900 |
| 2018 | $5,987 | $363,700 | $160,500 | $203,200 |
| 2017 | $5,733 | $345,800 | $160,500 | $185,300 |
| 2016 | $5,564 | $342,000 | $155,000 | $187,000 |
| 2015 | $5,257 | $338,300 | $149,500 | $188,800 |
| 2014 | $4,988 | $329,700 | $149,500 | $180,200 |
Source: Public Records
Map
Nearby Homes
- 36 Lawrence Rd
- 40 Lawrence Rd
- 56 Pinehurst Dr
- 57 Pinehurst Dr
- 37 Lawrence Rd
- 54 Pinehurst Dr
- 34 Lawrence Rd
- 33 Lawrence Rd
- 42 Lawrence Rd
- 52 Pinehurst Dr
- 60 Pinehurst Dr
- 116 Pinehurst Dr
- 43 Lawrence Rd
- 51 Pinehurst Dr
- 115 Pinehurst Dr
- 114 Pinehurst Dr
- 117 Pinehurst Dr
- 31 Lawrence Rd
- 32 Lawrence Rd
- 118 Pinehurst Dr