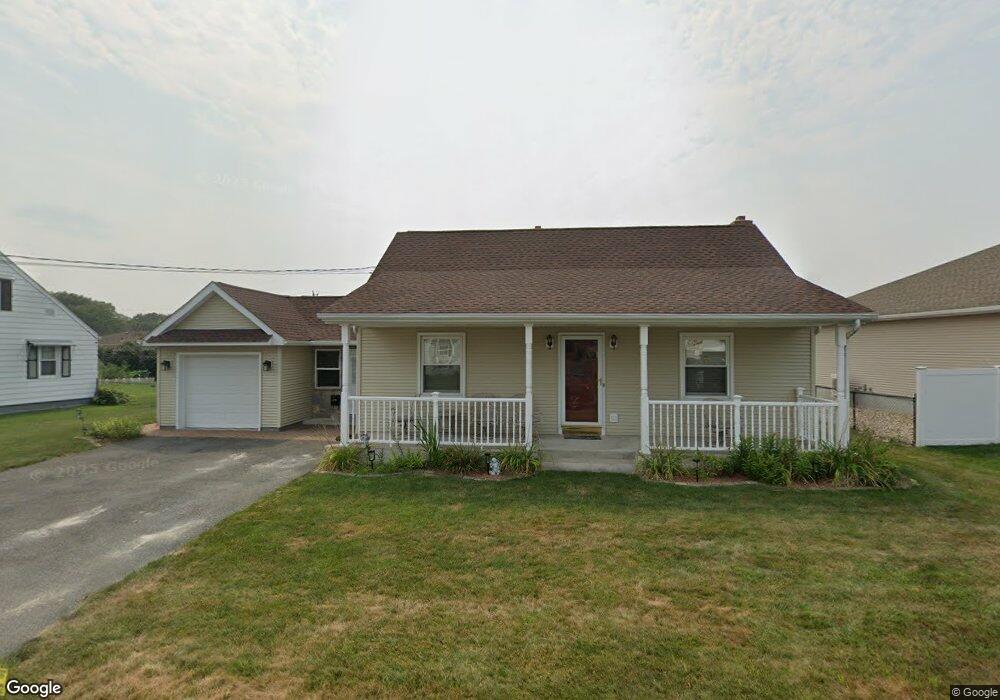
38 Lehigh St Ludlow, MA 01056
Estimated Value: $294,000 - $349,000
3
Beds
2
Baths
1,287
Sq Ft
$250/Sq Ft
Est. Value
About This Home
This home is located at 38 Lehigh St, Ludlow, MA 01056 and is currently estimated at $321,219, approximately $249 per square foot. 38 Lehigh St is a home located in Hampden County with nearby schools including East Street Elementary School, Chapin Street Elementary School, and Paul R. Baird Middle School.
Ownership History
Date
Name
Owned For
Owner Type
Purchase Details
Closed on
Jul 22, 2004
Sold by
Afonso Jose J and Afonso Maria C
Bought by
Faria Carlos M and Faria Stella M
Current Estimated Value
Home Financials for this Owner
Home Financials are based on the most recent Mortgage that was taken out on this home.
Original Mortgage
$120,000
Outstanding Balance
$59,759
Interest Rate
6.28%
Mortgage Type
Purchase Money Mortgage
Estimated Equity
$261,460
Create a Home Valuation Report for This Property
The Home Valuation Report is an in-depth analysis detailing your home's value as well as a comparison with similar homes in the area
Home Values in the Area
Average Home Value in this Area
Purchase History
| Date | Buyer | Sale Price | Title Company |
|---|---|---|---|
| Faria Carlos M | $120,000 | -- | |
| Faria Carlos M | $120,000 | -- |
Source: Public Records
Mortgage History
| Date | Status | Borrower | Loan Amount |
|---|---|---|---|
| Open | Faria Carlos M | $120,000 | |
| Closed | Faria Carlos M | $120,000 |
Source: Public Records
Tax History
| Year | Tax Paid | Tax Assessment Tax Assessment Total Assessment is a certain percentage of the fair market value that is determined by local assessors to be the total taxable value of land and additions on the property. | Land | Improvement |
|---|---|---|---|---|
| 2025 | $4,412 | $254,300 | $80,000 | $174,300 |
| 2024 | $4,296 | $237,500 | $80,000 | $157,500 |
| 2023 | $4,019 | $206,000 | $70,200 | $135,800 |
| 2022 | $3,828 | $191,500 | $70,200 | $121,300 |
| 2021 | $3,843 | $182,300 | $70,200 | $112,100 |
| 2020 | $3,681 | $178,500 | $69,100 | $109,400 |
| 2019 | $3,435 | $173,300 | $68,500 | $104,800 |
| 2018 | $3,218 | $169,300 | $68,500 | $100,800 |
| 2017 | $3,054 | $164,800 | $67,100 | $97,700 |
| 2016 | $2,897 | $159,800 | $65,800 | $94,000 |
| 2015 | $2,720 | $157,300 | $65,100 | $92,200 |
Source: Public Records
Map
Nearby Homes
- 374 East St
- 31 Greenwich St
- 37 Franklin St
- 59 Prospect St
- 287 East St
- 162 Highland Ave
- 259 Prospect St
- 63 Oak St
- 25 Dale St
- 2205 Boston Rd Unit Q160
- 0 Center St Unit 73415933
- 26 Swan Ave
- 350 West Ave Unit 5
- 24 Lodge Ln Unit 24
- 24 Dumaine St
- 12 Weston St
- 144 Stony Hill Rd
- 70 Sroka Ln
- 39 Rogers Ave
- 84 Chapin Greene Dr
Your Personal Tour Guide
Ask me questions while you tour the home.