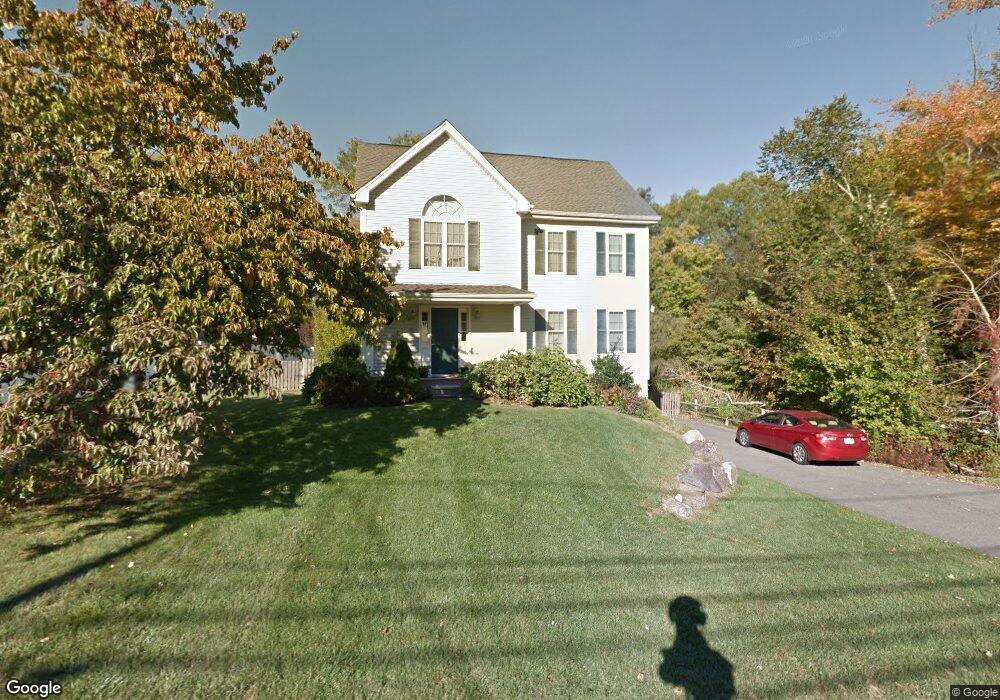
38 Lindsey St North Attleboro, MA 02760
Estimated Value: $637,186 - $784,000
3
Beds
3
Baths
1,568
Sq Ft
$442/Sq Ft
Est. Value
About This Home
This home is located at 38 Lindsey St, North Attleboro, MA 02760 and is currently estimated at $693,047, approximately $441 per square foot. 38 Lindsey St is a home located in Bristol County with nearby schools including North Attleboro High School, Cadence Academy Preschool - North Attleborough, and St John The Evangelist School.
Ownership History
Date
Name
Owned For
Owner Type
Purchase Details
Closed on
Mar 27, 2003
Sold by
Corporate Constr Ltd
Bought by
George-Hennessy Kristen M and Hennessy Michael O
Current Estimated Value
Home Financials for this Owner
Home Financials are based on the most recent Mortgage that was taken out on this home.
Original Mortgage
$321,900
Outstanding Balance
$139,910
Interest Rate
5.91%
Mortgage Type
Purchase Money Mortgage
Estimated Equity
$553,137
Create a Home Valuation Report for This Property
The Home Valuation Report is an in-depth analysis detailing your home's value as well as a comparison with similar homes in the area
Home Values in the Area
Average Home Value in this Area
Purchase History
| Date | Buyer | Sale Price | Title Company |
|---|---|---|---|
| George-Hennessy Kristen M | $360,000 | -- | |
| Corporate Constr Ltd | -- | -- |
Source: Public Records
Mortgage History
| Date | Status | Borrower | Loan Amount |
|---|---|---|---|
| Open | George-Hennessy Kristen M | $321,900 |
Source: Public Records
Tax History Compared to Growth
Tax History
| Year | Tax Paid | Tax Assessment Tax Assessment Total Assessment is a certain percentage of the fair market value that is determined by local assessors to be the total taxable value of land and additions on the property. | Land | Improvement |
|---|---|---|---|---|
| 2025 | $6,029 | $511,400 | $132,800 | $378,600 |
| 2024 | $6,005 | $520,400 | $132,800 | $387,600 |
| 2023 | $5,612 | $438,800 | $132,800 | $306,000 |
| 2022 | $5,330 | $382,600 | $132,800 | $249,800 |
| 2021 | $5,297 | $371,200 | $132,800 | $238,400 |
| 2020 | $5,229 | $364,400 | $132,800 | $231,600 |
| 2019 | $5,091 | $357,500 | $120,800 | $236,700 |
| 2018 | $4,584 | $343,600 | $120,800 | $222,800 |
| 2017 | $4,542 | $343,600 | $120,800 | $222,800 |
| 2016 | $4,468 | $338,000 | $134,200 | $203,800 |
| 2015 | $4,373 | $332,800 | $140,900 | $191,900 |
| 2014 | $4,265 | $322,100 | $130,200 | $191,900 |
Source: Public Records
Map
Nearby Homes
- 11 Buckthorn Ln
- 255 Mckeon Dr
- 115 Westfield Dr
- 21 Shady Ln
- 20 Sperry Ln
- 196 Donald Tennant Cir
- 747 N Main St
- 150 Gilbert St
- 57 Vine St
- 11 Landry Ave
- 678 N Main St
- 451R Gilbert St
- 10 Hazelwood Ct
- 158 Ivy St
- 59 Laurelwood Dr
- 71 Richardson Ave
- Lot 2 Jeffrey Dr
- Lot 5 Jeffrey Dr
- 136 Lindsey St
- 29 Lyman St
- 1 Stonefield Ct
- 7 Stonefield Ct
- 27 Lindsey St
- 35 Lindsey St
- 19 Lindsey St
- 44 Lindsey St
- 2 Stonefield Ct
- 11 Stonefield Ct
- 45 Lindsey St
- 68 Lindsey St
- 1 Lindsey St
- 53 Lindsey St
- 53 Lindsey St Unit 53
- 12 Stonefield Ct
- 7 Jacap Dr
- 78 Lindsey St
- 21 Stonefield Ct
- 16 Whalen Dr
- 65 Lindsey St
- Lot 3 Ashden Ct (36)