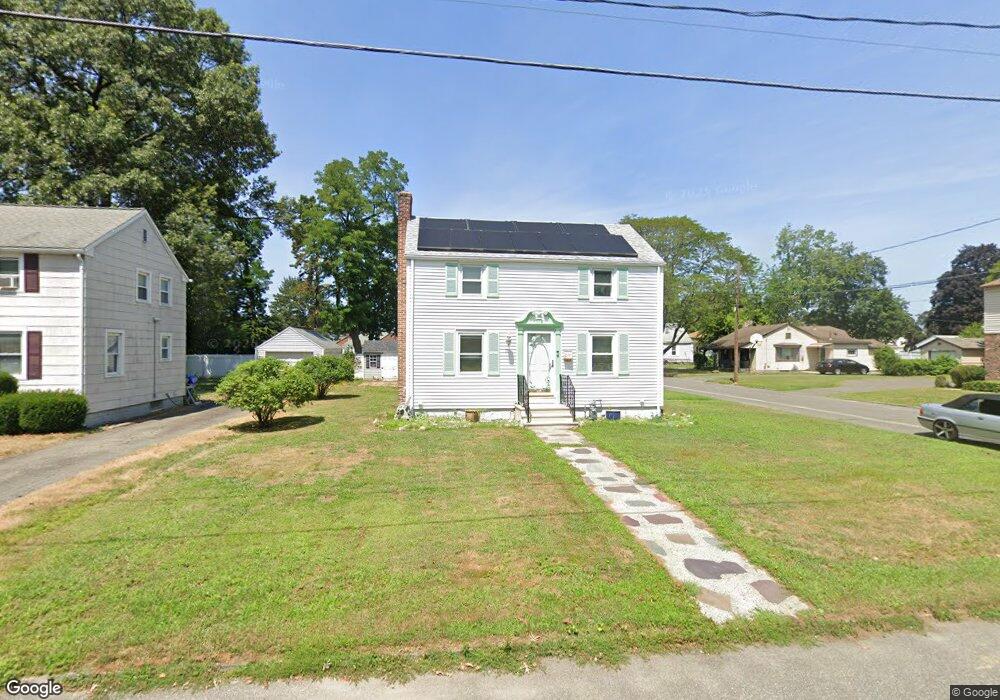
38 Linnell St Springfield, MA 01104
East Springfield NeighborhoodEstimated Value: $230,000 - $253,357
2
Beds
1
Bath
798
Sq Ft
$302/Sq Ft
Est. Value
About This Home
This home is located at 38 Linnell St, Springfield, MA 01104 and is currently estimated at $241,339, approximately $302 per square foot. 38 Linnell St is a home located in Hampden County with nearby schools including Mary O. Pottenger Elementary School, Van Sickle Academy, and Springfield Central High School.
Ownership History
Date
Name
Owned For
Owner Type
Purchase Details
Closed on
Jun 26, 1998
Sold by
Mcnulty Muriel I
Bought by
Ramos Nancy
Current Estimated Value
Home Financials for this Owner
Home Financials are based on the most recent Mortgage that was taken out on this home.
Original Mortgage
$57,950
Outstanding Balance
$10,991
Interest Rate
7.09%
Mortgage Type
Purchase Money Mortgage
Estimated Equity
$230,348
Create a Home Valuation Report for This Property
The Home Valuation Report is an in-depth analysis detailing your home's value as well as a comparison with similar homes in the area
Home Values in the Area
Average Home Value in this Area
Purchase History
| Date | Buyer | Sale Price | Title Company |
|---|---|---|---|
| Ramos Nancy | $61,000 | -- |
Source: Public Records
Mortgage History
| Date | Status | Borrower | Loan Amount |
|---|---|---|---|
| Open | Ramos Nancy | $57,950 | |
| Closed | Ramos Nancy | $2,220 |
Source: Public Records
Tax History
| Year | Tax Paid | Tax Assessment Tax Assessment Total Assessment is a certain percentage of the fair market value that is determined by local assessors to be the total taxable value of land and additions on the property. | Land | Improvement |
|---|---|---|---|---|
| 2025 | $3,578 | $228,200 | $38,000 | $190,200 |
| 2024 | $3,021 | $188,100 | $38,000 | $150,100 |
| 2023 | $3,270 | $191,800 | $35,400 | $156,400 |
| 2022 | $3,433 | $182,400 | $33,100 | $149,300 |
| 2021 | $2,941 | $155,600 | $30,100 | $125,500 |
| 2020 | $2,939 | $150,500 | $30,100 | $120,400 |
| 2019 | $1,956 | $99,400 | $31,100 | $68,300 |
| 2018 | $2,153 | $109,400 | $31,100 | $78,300 |
| 2017 | $2,117 | $107,700 | $28,100 | $79,600 |
| 2016 | $1,937 | $98,500 | $28,100 | $70,400 |
| 2015 | $1,939 | $98,600 | $28,100 | $70,500 |
Source: Public Records
Map
Nearby Homes
- 126 Windemere St
- 66 Thornton St
- 3 Fordham St
- 112 W Canton Cir
- 456-458 Page Blvd
- 114 Monrovia St
- 47 Holy Cross St
- 152 Monrovia St
- 158 Monrovia St
- 104 Chateaugay St
- 70 Chateaugay St
- 147 Bowles Park
- 58 Eureka St
- 105 Lachine St
- 191 Monrovia St
- 890-892 Saint James Ave
- 884-886 Saint James Ave
- 878-880 Saint James Ave
- 2408 Roosevelt Ave
- 49 Upland St
Your Personal Tour Guide
Ask me questions while you tour the home.