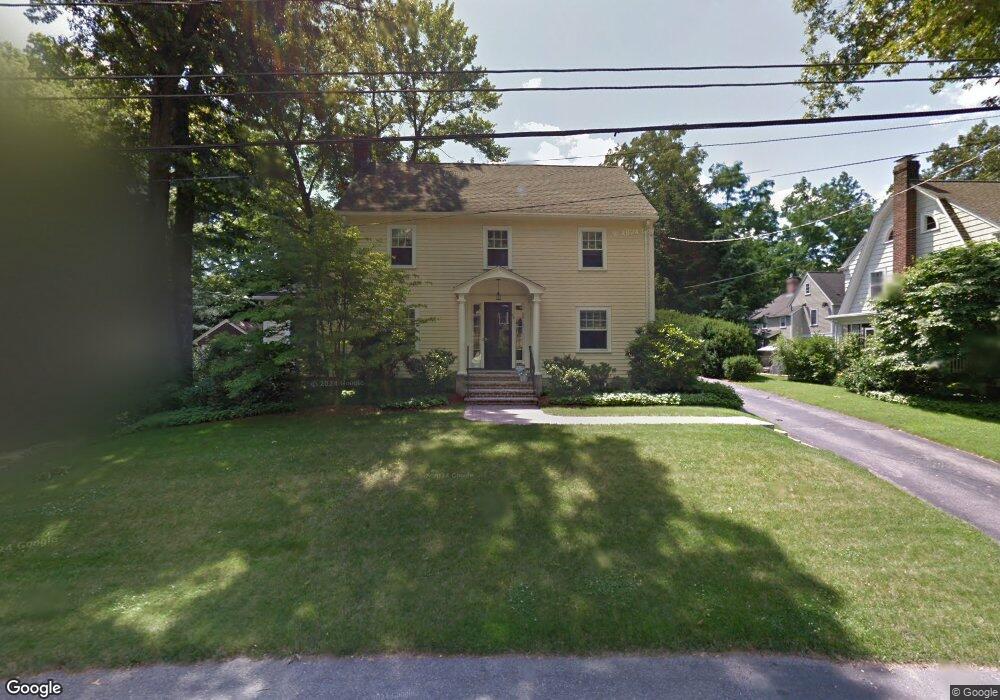
38 Locust Ave Lexington, MA 02421
Follen Heights NeighborhoodEstimated Value: $1,128,000 - $1,547,000
4
Beds
2
Baths
1,704
Sq Ft
$783/Sq Ft
Est. Value
About This Home
This home is located at 38 Locust Ave, Lexington, MA 02421 and is currently estimated at $1,334,118, approximately $782 per square foot. 38 Locust Ave is a home located in Middlesex County with nearby schools including Bowman Elementary School, Jonas Clarke Middle School, and Lexington High School.
Ownership History
Date
Name
Owned For
Owner Type
Purchase Details
Closed on
Aug 29, 2024
Sold by
Flaherty Paul A and Flaherty Kathleen
Bought by
Flaherty Ft and Flaherty
Current Estimated Value
Purchase Details
Closed on
Jun 30, 1987
Sold by
Mccarthy Elizabeth
Bought by
Flaherty Paul A
Home Financials for this Owner
Home Financials are based on the most recent Mortgage that was taken out on this home.
Original Mortgage
$100,000
Interest Rate
10.5%
Mortgage Type
Purchase Money Mortgage
Create a Home Valuation Report for This Property
The Home Valuation Report is an in-depth analysis detailing your home's value as well as a comparison with similar homes in the area
Home Values in the Area
Average Home Value in this Area
Purchase History
| Date | Buyer | Sale Price | Title Company |
|---|---|---|---|
| Flaherty Ft | -- | None Available | |
| Flaherty Ft | -- | None Available | |
| Flaherty Paul A | $350,000 | -- |
Source: Public Records
Mortgage History
| Date | Status | Borrower | Loan Amount |
|---|---|---|---|
| Previous Owner | Flaherty Paul A | $100,000 |
Source: Public Records
Tax History
| Year | Tax Paid | Tax Assessment Tax Assessment Total Assessment is a certain percentage of the fair market value that is determined by local assessors to be the total taxable value of land and additions on the property. | Land | Improvement |
|---|---|---|---|---|
| 2025 | $16,254 | $1,329,000 | $961,000 | $368,000 |
| 2024 | $15,717 | $1,283,000 | $915,000 | $368,000 |
| 2023 | $15,314 | $1,178,000 | $832,000 | $346,000 |
| 2022 | $14,559 | $1,055,000 | $756,000 | $299,000 |
| 2021 | $14,203 | $987,000 | $720,000 | $267,000 |
| 2020 | $13,797 | $982,000 | $720,000 | $262,000 |
| 2019 | $13,767 | $975,000 | $686,000 | $289,000 |
| 2018 | $13,142 | $919,000 | $635,000 | $284,000 |
| 2017 | $11,824 | $816,000 | $605,000 | $211,000 |
| 2016 | $11,169 | $765,000 | $555,000 | $210,000 |
| 2015 | $10,848 | $730,000 | $505,000 | $225,000 |
| 2014 | $10,035 | $647,000 | $452,000 | $195,000 |
Source: Public Records
Map
Nearby Homes
- 991 Massachusetts Ave
- 1 Tricorne Rd
- 20 Maple St
- 25 Maple St
- 2 Beech Tree Ln
- 9 Pelham Rd
- 10 Eliot Rd
- 15 Bird Hill Rd
- 32 Moon Hill Rd
- 34 Allen St
- 12 Wellington Lane Ave
- 51 Bloomfield St
- 65 Sherburne Rd S
- 16 Lily Pond Ln Unit 16
- 1437 Massachusetts Ave
- 82 Oak St
- 3 Effie Place
- 48 Grapevine Ave
- 15 Slocum Rd
- 1475 Massachusetts Ave Unit 467
Your Personal Tour Guide
Ask me questions while you tour the home.