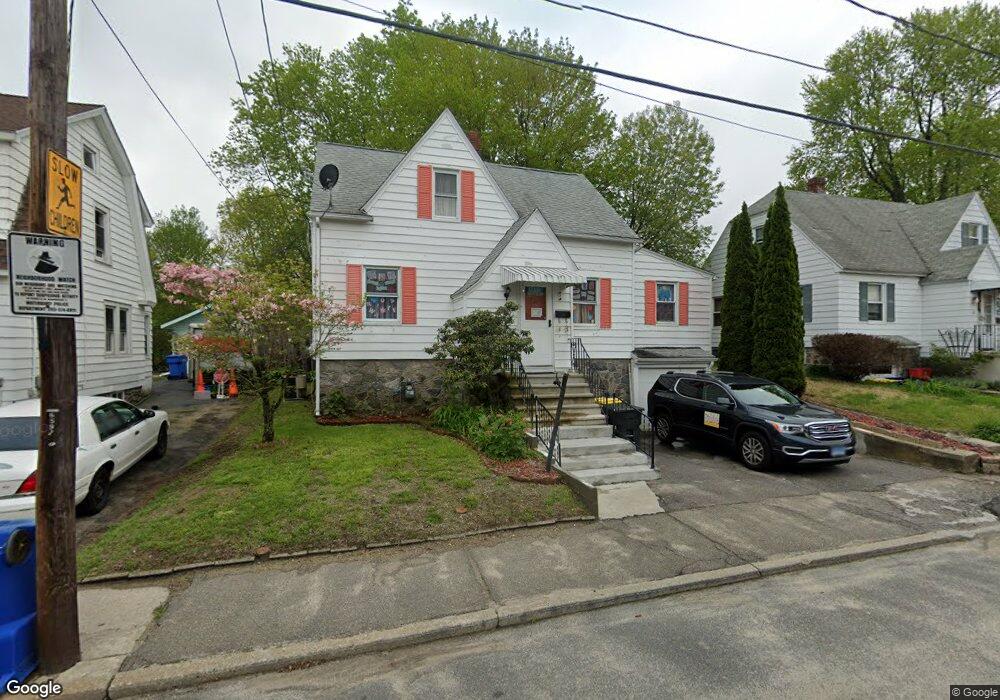
38 Lydia St Waterbury, CT 06705
East End District NeighborhoodEstimated Value: $225,000 - $291,000
3
Beds
2
Baths
1,170
Sq Ft
$221/Sq Ft
Est. Value
About This Home
This home is located at 38 Lydia St, Waterbury, CT 06705 and is currently estimated at $258,267, approximately $220 per square foot. 38 Lydia St is a home located in New Haven County with nearby schools including Walsh School, Michael F. Wallace Middle School, and Crosby High School.
Ownership History
Date
Name
Owned For
Owner Type
Purchase Details
Closed on
Apr 28, 2003
Sold by
Silvia Anna P
Bought by
Torrian Llc
Current Estimated Value
Purchase Details
Closed on
Dec 16, 1999
Sold by
All County Inv
Bought by
Silva Francisco M and Silva Anna P
Purchase Details
Closed on
Nov 19, 1998
Sold by
Ocwen Fed Bank
Bought by
All County Inv
Purchase Details
Closed on
May 18, 1989
Sold by
Mchugh Mark L
Bought by
Lucisano Mark
Create a Home Valuation Report for This Property
The Home Valuation Report is an in-depth analysis detailing your home's value as well as a comparison with similar homes in the area
Home Values in the Area
Average Home Value in this Area
Purchase History
| Date | Buyer | Sale Price | Title Company |
|---|---|---|---|
| Torrian Llc | $104,400 | -- | |
| Silva Francisco M | $85,000 | -- | |
| All County Inv | $45,000 | -- | |
| Lucisano Mark | $118,000 | -- |
Source: Public Records
Mortgage History
| Date | Status | Borrower | Loan Amount |
|---|---|---|---|
| Closed | Lucisano Mark | $13,959 | |
| Open | Lucisano Mark | $150,000 | |
| Closed | Lucisano Mark | $35,000 |
Source: Public Records
Tax History Compared to Growth
Tax History
| Year | Tax Paid | Tax Assessment Tax Assessment Total Assessment is a certain percentage of the fair market value that is determined by local assessors to be the total taxable value of land and additions on the property. | Land | Improvement |
|---|---|---|---|---|
| 2025 | $4,808 | $106,890 | $17,570 | $89,320 |
| 2024 | $5,285 | $106,890 | $17,570 | $89,320 |
| 2023 | $5,792 | $106,890 | $17,570 | $89,320 |
| 2022 | $3,623 | $60,180 | $17,580 | $42,600 |
| 2021 | $3,623 | $60,180 | $17,580 | $42,600 |
| 2020 | $3,623 | $60,180 | $17,580 | $42,600 |
| 2019 | $3,623 | $60,180 | $17,580 | $42,600 |
| 2018 | $3,623 | $60,180 | $17,580 | $42,600 |
| 2017 | $3,973 | $65,980 | $17,580 | $48,400 |
| 2016 | $3,973 | $65,980 | $17,580 | $48,400 |
| 2015 | $3,841 | $65,980 | $17,580 | $48,400 |
| 2014 | $3,841 | $65,980 | $17,580 | $48,400 |
Source: Public Records
Map
Nearby Homes