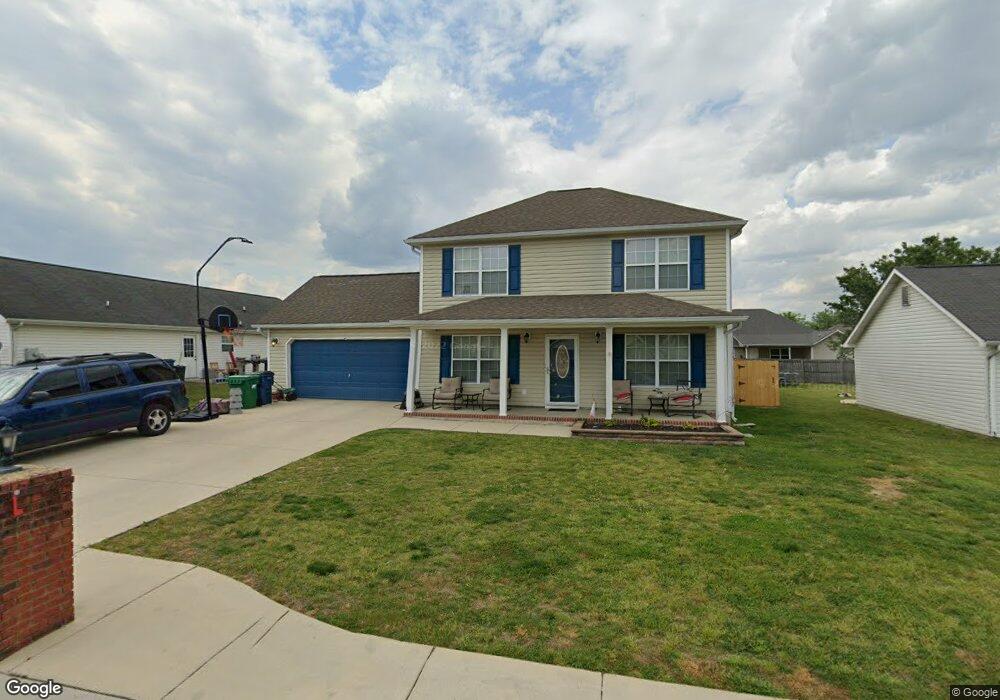
38 Lynn Murdock Ln Rossville, GA 30741
Estimated Value: $245,000 - $273,000
3
Beds
2
Baths
1,460
Sq Ft
$174/Sq Ft
Est. Value
About This Home
This home is located at 38 Lynn Murdock Ln, Rossville, GA 30741 and is currently estimated at $254,237, approximately $174 per square foot. 38 Lynn Murdock Ln is a home located in Walker County with nearby schools including Rossville Elementary School, Rossville Middle School, and Ridgeland High School.
Ownership History
Date
Name
Owned For
Owner Type
Purchase Details
Closed on
Jul 13, 2010
Sold by
Bank Of Chickamauga
Bought by
Duran Jacob Matthew
Current Estimated Value
Home Financials for this Owner
Home Financials are based on the most recent Mortgage that was taken out on this home.
Original Mortgage
$80,910
Outstanding Balance
$55,820
Interest Rate
5.5%
Mortgage Type
FHA
Estimated Equity
$198,417
Purchase Details
Closed on
Apr 6, 2010
Sold by
Blakemore Charles Raymond
Bought by
Bank Of Chickamauga
Purchase Details
Closed on
Oct 10, 2008
Sold by
Blakemore Charles Raymond
Bought by
Blakemore Charles Raymond and Skyles Tracy Denise
Purchase Details
Closed on
Oct 2, 2008
Sold by
Not Provided
Bought by
Duran Jacob Matthew
Purchase Details
Closed on
Dec 30, 2005
Sold by
Not Provided
Bought by
Duran Jacob Matthew
Purchase Details
Closed on
Dec 29, 2004
Sold by
Baker & Summers Construction
Bought by
Faith Home Construction Llc
Purchase Details
Closed on
Mar 8, 2004
Bought by
Baker & Summers Construction
Create a Home Valuation Report for This Property
The Home Valuation Report is an in-depth analysis detailing your home's value as well as a comparison with similar homes in the area
Home Values in the Area
Average Home Value in this Area
Purchase History
| Date | Buyer | Sale Price | Title Company |
|---|---|---|---|
| Duran Jacob Matthew | $82,000 | -- | |
| Bank Of Chickamauga | -- | -- | |
| Blakemore Charles Raymond | -- | -- | |
| Duran Jacob Matthew | $108,371 | -- | |
| Duran Jacob Matthew | $110,000 | -- | |
| Faith Home Construction Llc | $23,000 | -- | |
| Baker & Summers Construction | $257,500 | -- |
Source: Public Records
Mortgage History
| Date | Status | Borrower | Loan Amount |
|---|---|---|---|
| Open | Bank Of Chickamauga | $80,910 |
Source: Public Records
Tax History Compared to Growth
Tax History
| Year | Tax Paid | Tax Assessment Tax Assessment Total Assessment is a certain percentage of the fair market value that is determined by local assessors to be the total taxable value of land and additions on the property. | Land | Improvement |
|---|---|---|---|---|
| 2024 | $2,734 | $83,726 | $4,800 | $78,926 |
| 2023 | $2,629 | $79,627 | $4,800 | $74,827 |
| 2022 | $1,825 | $69,312 | $4,800 | $64,512 |
| 2021 | $1,527 | $52,008 | $4,800 | $47,208 |
| 2020 | $1,293 | $42,132 | $4,800 | $37,332 |
| 2019 | $1,293 | $42,132 | $4,800 | $37,332 |
| 2018 | $1,253 | $42,132 | $4,800 | $37,332 |
| 2017 | $1,400 | $42,132 | $4,800 | $37,332 |
| 2016 | $1,162 | $42,132 | $4,800 | $37,332 |
| 2015 | $1,015 | $35,076 | $4,800 | $30,276 |
| 2014 | $977 | $35,076 | $4,800 | $30,276 |
| 2013 | -- | $35,076 | $4,800 | $30,276 |
Source: Public Records
Map
Nearby Homes
- 527 W Gordon Ave
- 509 W Gordon Ave
- 1410 E 50th St
- 1403 E 49th St
- 1405 E 49th St
- 816 Indian Ave
- 200 W Oak St
- 53 Charlsie Trail Unit 12
- 916 Logan Ave
- 1014 Lee Ave
- 1014 Wilson Rd
- 806 Mcfarland Ave
- 115 Beech St
- 1604 E 46th Street Place
- 1614 E 47th St
- 1515 E 50th St
- 635 N Sherry Dr
- 126 S Liner St
- 105 Elm St
- 1204 Wooden Ave
- 44 Lynn Murdock Ln
- 22 Lynn Murdock Ln
- 442 Glenn Wade Dr
- 10 Lynn Murdock Ln
- 37 Lynn Murdock Ln
- 464 Glenn Wade Dr
- 25 Lynn Murdock Ln
- 45 Lynn Murdock Ln
- 45 Lynn Murdock Ln
- 11 Lynn Murdock Ln
- 472 Glenn Wade Dr
- 383 Glenn Wade Dr
- 12 Lynn Murdock Ln
- 0 Lynn Murdock Ln Unit 1079092
- 0 Lynn Murdock Ln Unit 1080567
- 375 Glenn Wade Dr
- 403 Glenn Wade Dr
- 451 Glenn Wade Dr
- 359 Glenn Wade Dr
- 465 Glenn Wade Dr