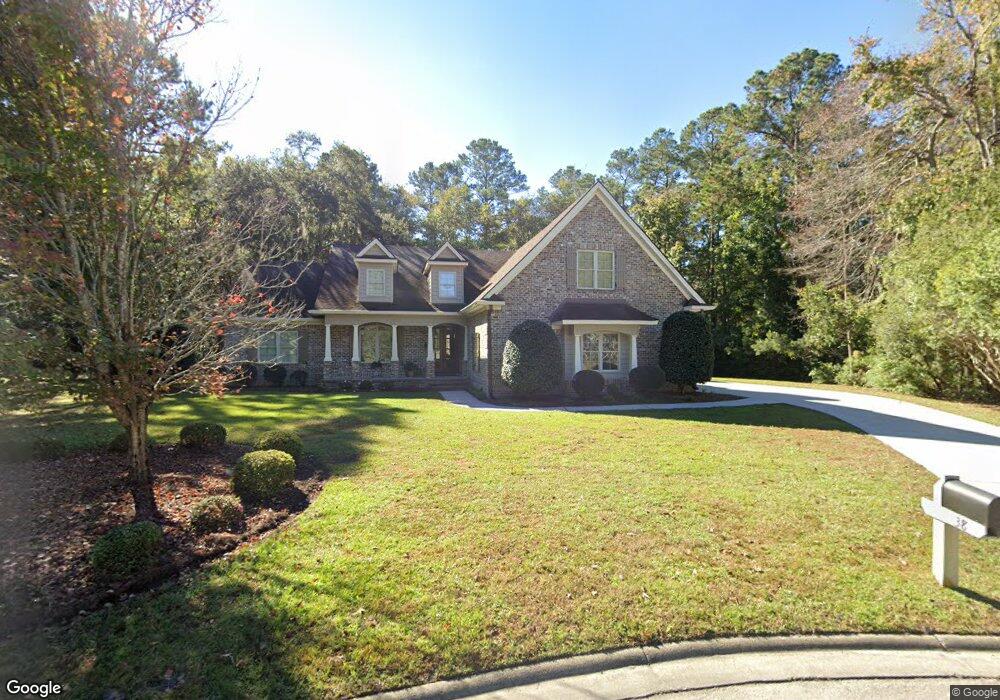
38 Macbeth Ct S Richmond Hill, GA 31324
Estimated Value: $542,000 - $655,000
4
Beds
3
Baths
3,227
Sq Ft
$186/Sq Ft
Est. Value
About This Home
This home is located at 38 Macbeth Ct S, Richmond Hill, GA 31324 and is currently estimated at $601,610, approximately $186 per square foot. 38 Macbeth Ct S is a home with nearby schools including Dr. George Washington Carver Elementary School, Richmond Hill Elementary School, and Richmond Hill Middle School.
Ownership History
Date
Name
Owned For
Owner Type
Purchase Details
Closed on
Jan 31, 2018
Sold by
James R Hagan
Bought by
Clay Asa
Current Estimated Value
Home Financials for this Owner
Home Financials are based on the most recent Mortgage that was taken out on this home.
Original Mortgage
$333,750
Outstanding Balance
$283,783
Interest Rate
4.15%
Estimated Equity
$317,827
Purchase Details
Closed on
Jan 12, 2017
Sold by
Kathy T Nielsen
Bought by
Clay Asa
Home Financials for this Owner
Home Financials are based on the most recent Mortgage that was taken out on this home.
Original Mortgage
$348,750
Interest Rate
4.12%
Purchase Details
Closed on
Nov 17, 2008
Sold by
Platinum Homes Llc
Bought by
Clay Asa and Clay Joann B
Purchase Details
Closed on
Nov 2, 2006
Bought by
Platinum Homes Llc
Create a Home Valuation Report for This Property
The Home Valuation Report is an in-depth analysis detailing your home's value as well as a comparison with similar homes in the area
Home Values in the Area
Average Home Value in this Area
Purchase History
| Date | Buyer | Sale Price | Title Company |
|---|---|---|---|
| Clay Asa | -- | -- | |
| Clay Asa | -- | -- | |
| Clay Asa | $84,849 | -- | |
| Platinum Homes Llc | $70,900 | -- |
Source: Public Records
Mortgage History
| Date | Status | Borrower | Loan Amount |
|---|---|---|---|
| Open | Clay Asa | $333,750 | |
| Closed | Clay Asa | -- | |
| Previous Owner | Clay Asa | $348,750 | |
| Previous Owner | Clay Asa | -- |
Source: Public Records
Tax History Compared to Growth
Tax History
| Year | Tax Paid | Tax Assessment Tax Assessment Total Assessment is a certain percentage of the fair market value that is determined by local assessors to be the total taxable value of land and additions on the property. | Land | Improvement |
|---|---|---|---|---|
| 2024 | $4,349 | $223,640 | $28,800 | $194,840 |
| 2023 | $4,349 | $189,880 | $28,800 | $161,080 |
| 2022 | $2,804 | $150,360 | $28,800 | $121,560 |
| 2021 | $2,746 | $145,480 | $28,800 | $116,680 |
| 2020 | $3,621 | $145,480 | $28,800 | $116,680 |
| 2019 | $2,755 | $143,680 | $28,800 | $114,880 |
| 2018 | $2,663 | $141,880 | $27,000 | $114,880 |
| 2017 | $2,606 | $144,640 | $29,680 | $114,960 |
| 2016 | $2,546 | $141,160 | $29,680 | $111,480 |
| 2015 | $3,428 | $138,800 | $29,680 | $109,120 |
| 2014 | $3,492 | $141,120 | $29,680 | $111,440 |
Source: Public Records
Map
Nearby Homes
- 126 Carapace Ct
- 139 Mingarry Dr
- 360 Beauly Dr
- 165 Tralee Ct
- 0 Rathlin Rd Unit B SA337045
- 27 Dover Dr
- 80 Windsong Dr
- 395 Dublin Dr
- 160 Orchard Rd
- 317 Mcgregor Cir
- 195 Cubbage Island Dr
- 97 Cubbage Island Dr
- 73 Waldburg Way
- 360 Laurenburg Dr
- 448 Laurenburg Dr
- 325 Shadow Moss Cir
- 99 Mcgregor Cir
- 172 Lou Page Ln
- 439 Laurenburg Dr
- 53 Mcneil Trail
- 37 Macbeth Ct S
- 32 Macbeth Ct S
- 19 Macbeth Ct S
- 19 Macbeth Ct S
- 52 Moreton Dr S
- 18 Macbeth Ct N
- 52 Moreton Dr S
- 36 Moreton Dr S
- 14 Moreton Dr S
- 1 Macbeth Ct N
- 60 Moreton Dr S
- 40 Beagram Ct
- 60 Moreton Dr S
- 16 Macbeth Ct N
- 24 Beagram Ct
- 24 Beagram Ct
- 54 Beagram Ct
- 19 Moreton Dr N
- 23 Macbeth Ct N
- 19 Moreton Dr N