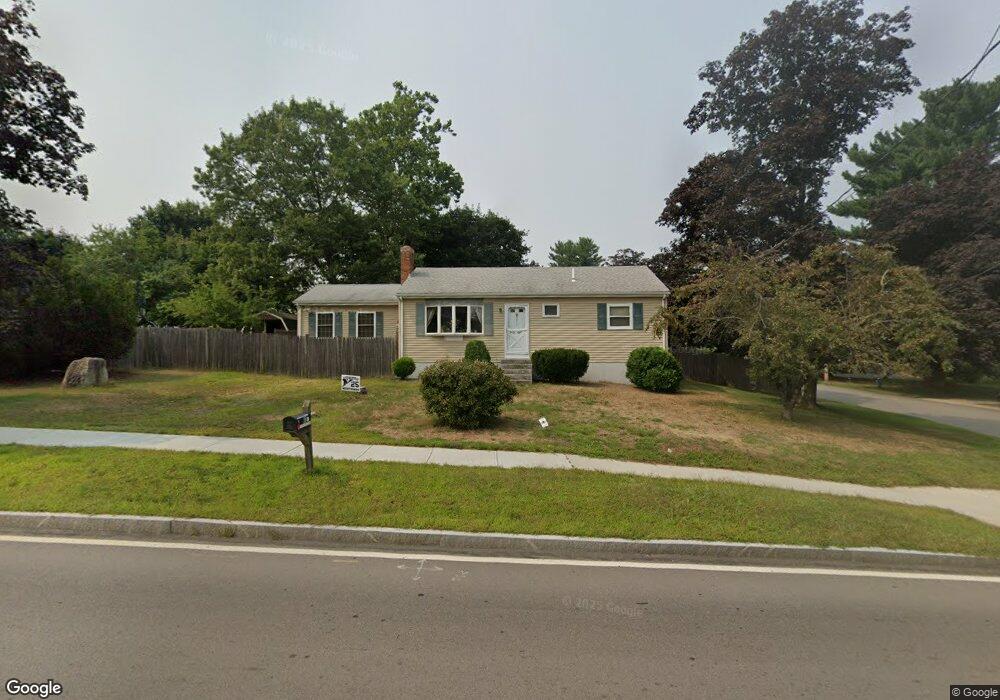
38 Main St Medway, MA 02053
Estimated Value: $547,000 - $623,000
3
Beds
2
Baths
1,209
Sq Ft
$478/Sq Ft
Est. Value
About This Home
This home is located at 38 Main St, Medway, MA 02053 and is currently estimated at $577,520, approximately $477 per square foot. 38 Main St is a home located in Norfolk County with nearby schools including John D. McGovern Elementary School, Burke-Memorial Elementary, and Medway Middle School.
Ownership History
Date
Name
Owned For
Owner Type
Purchase Details
Closed on
Feb 28, 2002
Sold by
Clifford Scott D and Clifford Kathleen M
Bought by
Sheedy Timothy M and Sheedy Lourdes C
Current Estimated Value
Home Financials for this Owner
Home Financials are based on the most recent Mortgage that was taken out on this home.
Original Mortgage
$214,700
Interest Rate
6.85%
Mortgage Type
Purchase Money Mortgage
Purchase Details
Closed on
Nov 18, 1992
Sold by
Moran Scott A and Moran Dorothy M
Bought by
Clifford Scott D and Clifford Kathleen
Home Financials for this Owner
Home Financials are based on the most recent Mortgage that was taken out on this home.
Original Mortgage
$118,750
Interest Rate
7.95%
Mortgage Type
Purchase Money Mortgage
Create a Home Valuation Report for This Property
The Home Valuation Report is an in-depth analysis detailing your home's value as well as a comparison with similar homes in the area
Home Values in the Area
Average Home Value in this Area
Purchase History
| Date | Buyer | Sale Price | Title Company |
|---|---|---|---|
| Sheedy Timothy M | $226,000 | -- | |
| Clifford Scott D | $125,000 | -- |
Source: Public Records
Mortgage History
| Date | Status | Borrower | Loan Amount |
|---|---|---|---|
| Open | Clifford Scott D | $210,000 | |
| Closed | Sheedy Timothy M | $214,700 | |
| Previous Owner | Clifford Scott D | $117,000 | |
| Previous Owner | Clifford Scott D | $118,750 | |
| Previous Owner | Clifford Scott D | $80,000 |
Source: Public Records
Tax History Compared to Growth
Tax History
| Year | Tax Paid | Tax Assessment Tax Assessment Total Assessment is a certain percentage of the fair market value that is determined by local assessors to be the total taxable value of land and additions on the property. | Land | Improvement |
|---|---|---|---|---|
| 2025 | $6,165 | $432,600 | $254,700 | $177,900 |
| 2024 | $6,229 | $432,600 | $254,700 | $177,900 |
| 2023 | $5,957 | $373,700 | $222,300 | $151,400 |
| 2022 | $5,726 | $338,200 | $188,000 | $150,200 |
| 2021 | $5,533 | $316,900 | $169,800 | $147,100 |
| 2020 | $5,192 | $296,700 | $149,600 | $147,100 |
| 2019 | $4,828 | $284,500 | $141,500 | $143,000 |
| 2018 | $4,668 | $264,300 | $121,300 | $143,000 |
| 2017 | $4,632 | $258,500 | $121,300 | $137,200 |
| 2016 | $4,316 | $238,300 | $101,100 | $137,200 |
| 2015 | $4,347 | $238,300 | $101,100 | $137,200 |
| 2014 | $4,034 | $214,100 | $110,300 | $103,800 |
Source: Public Records
Map
Nearby Homes
- 50 Main St
- 3 Meryl St
- 106 Holliston St
- 12 Lovering St
- 22 Sunset Dr
- 36 Lovering St
- 20 Broad St Unit 6
- 20 Broad St Unit A
- 20 Broad St Unit 4
- 1 Walnut Ln
- 14 Heritage Dr
- 9 Sanford St
- 14 Sanford St Unit 15
- 30 Broken Tree Rd
- 16 Lexington Ln
- 280 Village St Unit D2
- 19 Sycamore Way Unit L40
- 4 Shaw St
- 841 Lincoln St
- 2 Spencer St