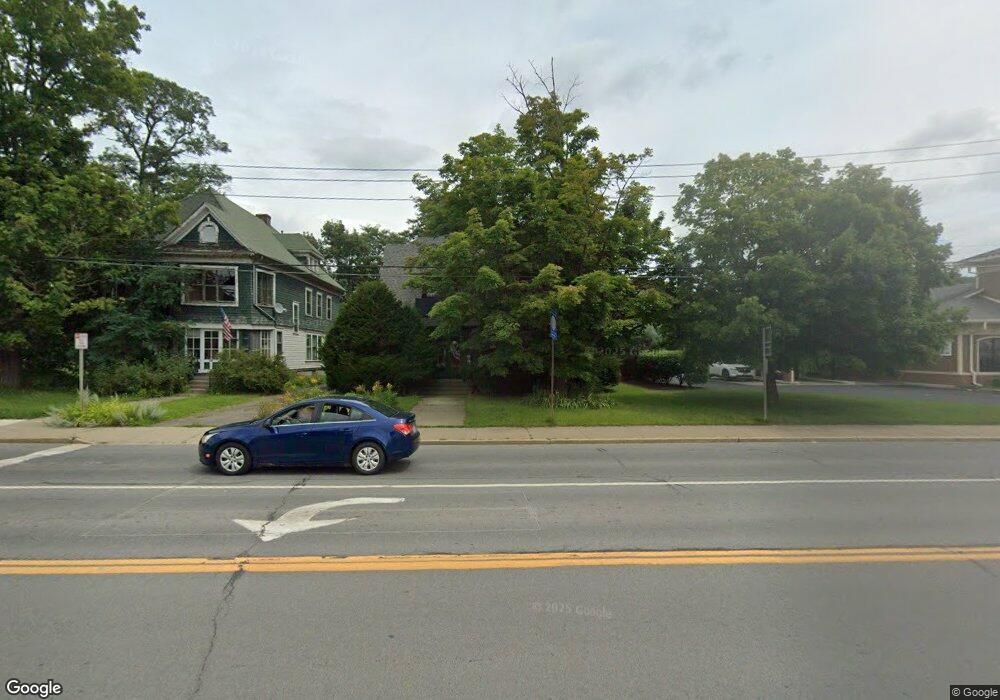
38 Main St Oneonta, NY 13820
Estimated Value: $260,693 - $446,000
8
Beds
3
Baths
3,680
Sq Ft
$93/Sq Ft
Est. Value
About This Home
This home is located at 38 Main St, Oneonta, NY 13820 and is currently estimated at $341,673, approximately $92 per square foot. 38 Main St is a home located in Otsego County with nearby schools including Oneonta Senior High School and Oneonta Community Christian School.
Ownership History
Date
Name
Owned For
Owner Type
Purchase Details
Closed on
Aug 21, 2018
Sold by
Spinosa Sunny J and Spinosa Emma
Bought by
Northern Catskill Props
Current Estimated Value
Purchase Details
Closed on
Aug 2, 2018
Sold by
Corona Joan
Bought by
Corona Joan and Reynolds James R
Purchase Details
Closed on
Mar 19, 2018
Sold by
Livingston Pamela F
Bought by
Spinosa Sunny J and Spinosa Emma
Purchase Details
Closed on
Jul 18, 2002
Sold by
Estate Of Johnson Bernard E Jr By
Bought by
Livingston Pamela F
Create a Home Valuation Report for This Property
The Home Valuation Report is an in-depth analysis detailing your home's value as well as a comparison with similar homes in the area
Home Values in the Area
Average Home Value in this Area
Purchase History
| Date | Buyer | Sale Price | Title Company |
|---|---|---|---|
| Northern Catskill Props | -- | -- | |
| Corona Joan | -- | -- | |
| Spinosa Sunny J | $69,500 | -- | |
| Livingston Pamela F | $45,000 | Lester A Sittler |
Source: Public Records
Tax History
| Year | Tax Paid | Tax Assessment Tax Assessment Total Assessment is a certain percentage of the fair market value that is determined by local assessors to be the total taxable value of land and additions on the property. | Land | Improvement |
|---|---|---|---|---|
| 2024 | $7,170 | $195,000 | $21,400 | $173,600 |
| 2023 | $5,764 | $195,000 | $21,400 | $173,600 |
| 2022 | $6,644 | $195,000 | $21,400 | $173,600 |
| 2021 | $6,617 | $195,000 | $21,400 | $173,600 |
| 2020 | $5,519 | $195,000 | $21,400 | $173,600 |
| 2019 | $5,309 | $195,000 | $21,400 | $173,600 |
| 2018 | $5,309 | $195,000 | $21,400 | $173,600 |
| 2017 | $5,270 | $195,000 | $21,400 | $173,600 |
| 2016 | $5,213 | $195,000 | $21,400 | $173,600 |
| 2015 | -- | $106,000 | $15,200 | $90,800 |
| 2014 | -- | $106,000 | $15,200 | $90,800 |
Source: Public Records
Map
Nearby Homes
Your Personal Tour Guide
Ask me questions while you tour the home.