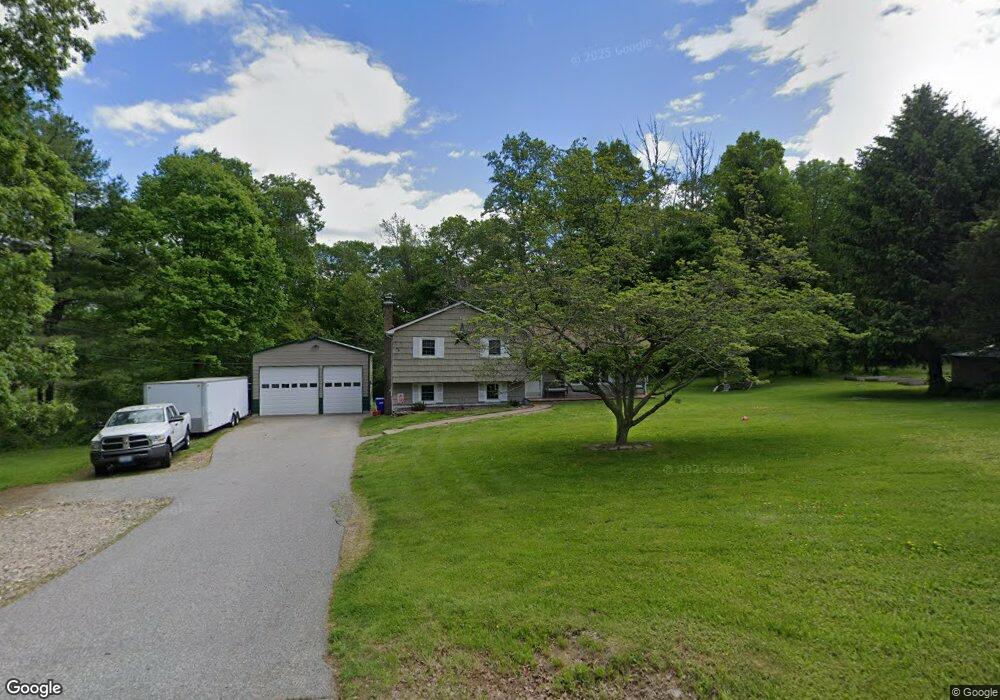
38 Mains Crossing Rd North Stonington, CT 06359
Estimated Value: $426,301 - $481,000
3
Beds
2
Baths
1,200
Sq Ft
$368/Sq Ft
Est. Value
About This Home
This home is located at 38 Mains Crossing Rd, North Stonington, CT 06359 and is currently estimated at $441,325, approximately $367 per square foot. 38 Mains Crossing Rd is a home located in New London County with nearby schools including North Stonington Elementary School, Wheeler High School, and North Stonington Christian Academy.
Ownership History
Date
Name
Owned For
Owner Type
Purchase Details
Closed on
Aug 3, 2015
Sold by
Dodge Np
Bought by
Verno Krista M and Verno Nicholas E
Current Estimated Value
Home Financials for this Owner
Home Financials are based on the most recent Mortgage that was taken out on this home.
Original Mortgage
$198,085
Outstanding Balance
$155,474
Interest Rate
3.97%
Estimated Equity
$285,851
Purchase Details
Closed on
Jul 27, 2011
Sold by
Brewster Ad Steven W and Brewster Steven W
Bought by
Grau Bryan C
Home Financials for this Owner
Home Financials are based on the most recent Mortgage that was taken out on this home.
Original Mortgage
$164,700
Interest Rate
4.52%
Mortgage Type
Purchase Money Mortgage
Purchase Details
Closed on
Nov 17, 2006
Sold by
Telesky Lawrence J and Telesky Bonnie L
Bought by
Brewster Steven
Home Financials for this Owner
Home Financials are based on the most recent Mortgage that was taken out on this home.
Original Mortgage
$238,728
Interest Rate
6.33%
Create a Home Valuation Report for This Property
The Home Valuation Report is an in-depth analysis detailing your home's value as well as a comparison with similar homes in the area
Home Values in the Area
Average Home Value in this Area
Purchase History
| Date | Buyer | Sale Price | Title Company |
|---|---|---|---|
| Verno Krista M | $219,000 | -- | |
| Dodge N P | $219,000 | -- | |
| Grau Bryan C | $183,000 | -- | |
| Brewster Steven | $242,500 | -- |
Source: Public Records
Mortgage History
| Date | Status | Borrower | Loan Amount |
|---|---|---|---|
| Open | Brewster Steven | $198,085 | |
| Previous Owner | Brewster Steven | $164,700 | |
| Previous Owner | Brewster Steven | $238,728 |
Source: Public Records
Tax History Compared to Growth
Tax History
| Year | Tax Paid | Tax Assessment Tax Assessment Total Assessment is a certain percentage of the fair market value that is determined by local assessors to be the total taxable value of land and additions on the property. | Land | Improvement |
|---|---|---|---|---|
| 2025 | $4,549 | $157,500 | $48,580 | $108,920 |
| 2024 | $4,549 | $157,500 | $48,580 | $108,920 |
| 2023 | $4,566 | $157,500 | $48,580 | $108,920 |
| 2022 | $4,481 | $157,500 | $48,580 | $108,920 |
| 2021 | $4,505 | $157,500 | $48,580 | $108,920 |
| 2020 | $3,901 | $132,230 | $47,460 | $84,770 |
| 2019 | $3,835 | $132,230 | $47,460 | $84,770 |
| 2018 | $3,729 | $132,230 | $47,460 | $84,770 |
| 2017 | $3,570 | $132,230 | $47,460 | $84,770 |
| 2016 | $3,570 | $132,230 | $47,460 | $84,770 |
| 2015 | $3,223 | $123,480 | $50,960 | $72,520 |
| 2014 | $3,192 | $123,480 | $50,960 | $72,520 |
Source: Public Records
Map
Nearby Homes
- 423 Norwich Westerly Rd
- 446 Norwich-Westerly Rd
- 39 Hewitt Rd
- 507 Norwich Westerly Rd
- 11 Meadow Wood Dr
- 26 Pinecrest Rd
- 616 Norwich Westerly Rd
- 72 Reutemann Rd
- 717 Norwich Westerly Rd
- 20 Providence New London Turnpike Unit Lot 19
- 135 Stony Brook Rd
- 19 Oak Dr
- 20 Providence-Nl Turnpike Unit 14A
- 45R Long Pond Rd S
- 4 Damato Dr
- 587 Taugwonk Rd
- 579 Taugwonk Rd
- 130 Stephen Dr
- 188 Wolf Neck Rd
- 550 Al Harvey Rd
- 38 Mains Crossing
- 38 Mains Crossing Unit RD
- 34 Mains Crossing Rd
- 42 Mains Crossing
- 50B Mains Crossing
- 31 Mains Crossing Rd
- 31 Mains Crossing Rd
- 30 Mains Crossing
- 46 Mains Crossing
- 35 Mains Crossing Rd
- 49 Mains Crossing
- 429 Norwich Westerly Rd
- 433 Norwich Westerly Rd
- 427 Norwich Westerly Rd
- 435 Norwich Westerly Rd
- 51 Mains Crossing
- 56 Mains Crossing
- 435 Norwich-Westerly Rd
- 27 Mains Crossing
- 51A Mains Crossing