
Landlord's Agent in 2014
Lisa Scourtas
RE/MAX
(617) 538-2400
21 in this area
48 Total Sales

Estimated Value: $631,797 - $770,000
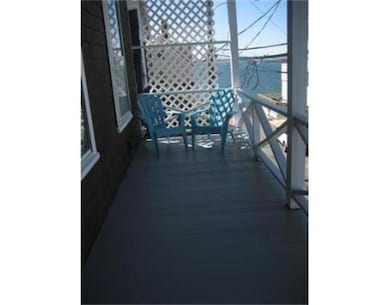
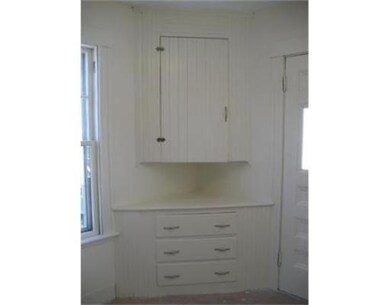
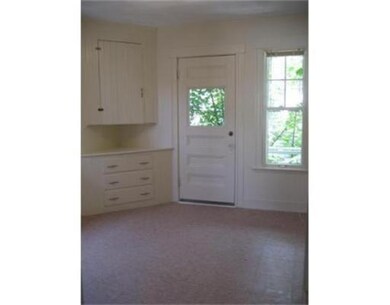
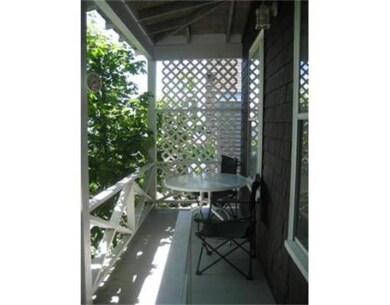
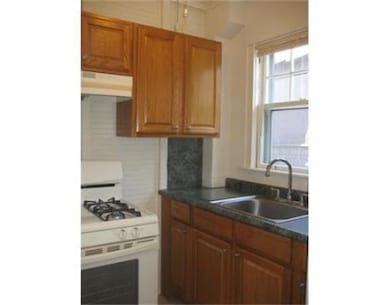
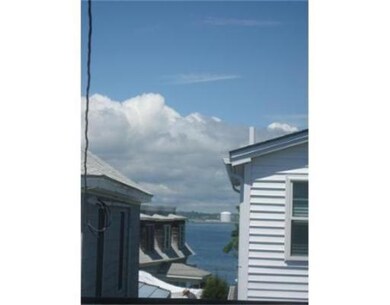
SUNNY SEASIDE LIVING Clean and bright, freshly painted and updated. Your opportunity to live in this charming seaside community with beautiful sandy beaches all around. Enjoy the views and ocean breezes from either the front covered porch or the rear porch...or walk across the street to the waterfront. Hardwood floors, new bathroom, on premises laundry. Plenty of parking is available - ask for details. Easy drive to Boston or take the nearby commuter rail. In town golf course, boating, nature trails. NO Dogs, cat only
Home Type
Other
Year Built
1930
Lot Details
1,307 Sq Ft Lot
| Date | Buyer | Sale Price | Title Company |
|---|---|---|---|
| Guthrie Karen A | $320,000 | -- | |
| Lessor David C | -- | -- | |
| Lessor David C | -- | -- |
| Date | Status | Borrower | Loan Amount |
|---|---|---|---|
| Open | Guthrie Karen A | $305,250 | |
| Closed | Lessor David C | $305,250 |
| Date | Event | Price | List to Sale | Price per Sq Ft |
|---|---|---|---|---|
| 03/24/2014 03/24/14 | Rented | $1,000 | 0.0% | -- |
| 02/22/2014 02/22/14 | Under Contract | -- | -- | -- |
| 12/21/2013 12/21/13 | For Rent | $1,000 | 0.0% | -- |
| 08/01/2012 08/01/12 | Rented | $1,000 | -13.0% | -- |
| 07/02/2012 07/02/12 | Under Contract | -- | -- | -- |
| 04/03/2012 04/03/12 | For Rent | $1,150 | -- | -- |
| Year | Tax Paid | Tax Assessment Tax Assessment Total Assessment is a certain percentage of the fair market value that is determined by local assessors to be the total taxable value of land and additions on the property. | Land | Improvement |
|---|---|---|---|---|
| 2025 | $4,787 | $523,200 | $295,100 | $228,100 |
| 2024 | $4,411 | $486,300 | $258,200 | $228,100 |
| 2023 | $4,025 | $442,800 | $243,500 | $199,300 |
| 2022 | $4,108 | $419,600 | $236,100 | $183,500 |
| 2021 | $4,034 | $383,800 | $221,300 | $162,500 |
| 2020 | $4,050 | $369,200 | $206,600 | $162,600 |
| 2019 | $3,637 | $333,400 | $191,800 | $141,600 |
| 2018 | $3,191 | $311,300 | $169,700 | $141,600 |
| 2017 | $3,259 | $311,300 | $169,700 | $141,600 |
| 2016 | $2,745 | $260,900 | $125,400 | $135,500 |
| 2015 | $2,781 | $254,700 | $119,200 | $135,500 |
| 2014 | $2,809 | $254,700 | $119,200 | $135,500 |
Landlord's Agent in 2014
Lisa Scourtas
RE/MAX
(617) 538-2400
21 in this area
48 Total Sales
Buyer's Agent in 2012
Barbara Kennedy-White
RE/MAX
(781) 254-1944
1 Total Sale
Source: MLS Property Information Network (MLS PIN)
MLS Number: 71617672
APN: NAHA-000021B-000000-000035
Disclaimer: Certain information contained herein is derived from information provided by parties other than Homes.com. All information provided is deemed reliable, but is not guaranteed to be accurate and should be independently verified.
![]() The property listing data and information, or the Images, set forth herein were provided to MLS Property Information Network, Inc. from third party sources, including sellers, lessors and public records, and were compiled by MLS Property Information Network, Inc. The property listing data and information, and the Images, are for the personal, non-commercial use of consumers having a good faith interest in purchasing or leasing listed properties of the type displayed to them and may not be used for any purpose other than to identify prospective properties which such consumers may have a good faith interest in purchasing or leasing. MLS Property Information Network, Inc. and its subscribers disclaim any and all representations and warranties as to the accuracy of the property listing data and information, or as to the accuracy of any of the Images, set forth herein.
The property listing data and information, or the Images, set forth herein were provided to MLS Property Information Network, Inc. from third party sources, including sellers, lessors and public records, and were compiled by MLS Property Information Network, Inc. The property listing data and information, and the Images, are for the personal, non-commercial use of consumers having a good faith interest in purchasing or leasing listed properties of the type displayed to them and may not be used for any purpose other than to identify prospective properties which such consumers may have a good faith interest in purchasing or leasing. MLS Property Information Network, Inc. and its subscribers disclaim any and all representations and warranties as to the accuracy of the property listing data and information, or as to the accuracy of any of the Images, set forth herein.
Ask me questions while you tour the home.