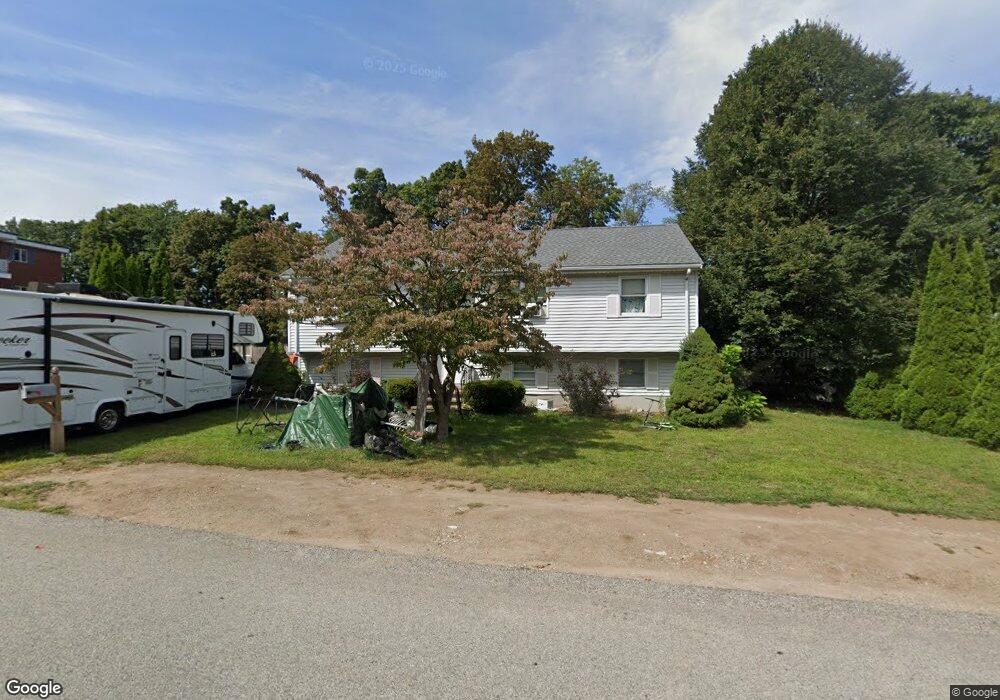
38 Maple St East Weymouth, MA 02189
East Weymouth NeighborhoodEstimated Value: $570,000 - $707,000
3
Beds
2
Baths
1,130
Sq Ft
$545/Sq Ft
Est. Value
About This Home
This home is located at 38 Maple St, East Weymouth, MA 02189 and is currently estimated at $615,789, approximately $544 per square foot. 38 Maple St is a home located in Norfolk County with nearby schools including Abigail Adams Middle School, Academy Avenue Elementary School, and Weymouth Middle School Chapman.
Ownership History
Date
Name
Owned For
Owner Type
Purchase Details
Closed on
Apr 25, 1990
Sold by
Furbish Ronald C
Bought by
Singh Damoder
Current Estimated Value
Home Financials for this Owner
Home Financials are based on the most recent Mortgage that was taken out on this home.
Original Mortgage
$100,000
Interest Rate
10.26%
Mortgage Type
Purchase Money Mortgage
Create a Home Valuation Report for This Property
The Home Valuation Report is an in-depth analysis detailing your home's value as well as a comparison with similar homes in the area
Home Values in the Area
Average Home Value in this Area
Purchase History
| Date | Buyer | Sale Price | Title Company |
|---|---|---|---|
| Singh Damoder | $126,000 | -- |
Source: Public Records
Mortgage History
| Date | Status | Borrower | Loan Amount |
|---|---|---|---|
| Closed | Singh Damoder | $100,000 | |
| Previous Owner | Singh Damoder | $8,000 |
Source: Public Records
Tax History Compared to Growth
Tax History
| Year | Tax Paid | Tax Assessment Tax Assessment Total Assessment is a certain percentage of the fair market value that is determined by local assessors to be the total taxable value of land and additions on the property. | Land | Improvement |
|---|---|---|---|---|
| 2025 | $5,705 | $564,900 | $206,500 | $358,400 |
| 2024 | $5,526 | $538,100 | $196,600 | $341,500 |
| 2023 | $5,209 | $498,500 | $182,100 | $316,400 |
| 2022 | $5,064 | $441,900 | $168,600 | $273,300 |
| 2021 | $4,696 | $400,000 | $168,600 | $231,400 |
| 2020 | $4,544 | $381,200 | $168,600 | $212,600 |
| 2019 | $4,432 | $365,700 | $162,100 | $203,600 |
| 2018 | $4,323 | $345,800 | $154,400 | $191,400 |
| 2017 | $4,221 | $329,500 | $147,100 | $182,400 |
| 2016 | $4,279 | $334,300 | $141,400 | $192,900 |
| 2015 | $3,671 | $284,600 | $141,400 | $143,200 |
| 2014 | $3,574 | $268,700 | $131,600 | $137,100 |
Source: Public Records
Map
Nearby Homes
- 56 Putnam St
- 29-31 Broad Street Place
- 575 Broad St Unit 305
- 575 Broad St Unit 215
- 425 East St
- 303 Middle St
- 30 Puritan Rd
- 209 Lake St Unit 69
- 20 Richards Rd
- 367 Essex St
- 669 Commercial St
- 286 Essex St
- 42 Sundin Rd
- 2 Winstead Rd
- 17 Grove St
- 38 School St Unit 2
- 12 Klasson Ln
- 43 Flint Locke Dr
- 1297 Pleasant St
- 286 Broad St