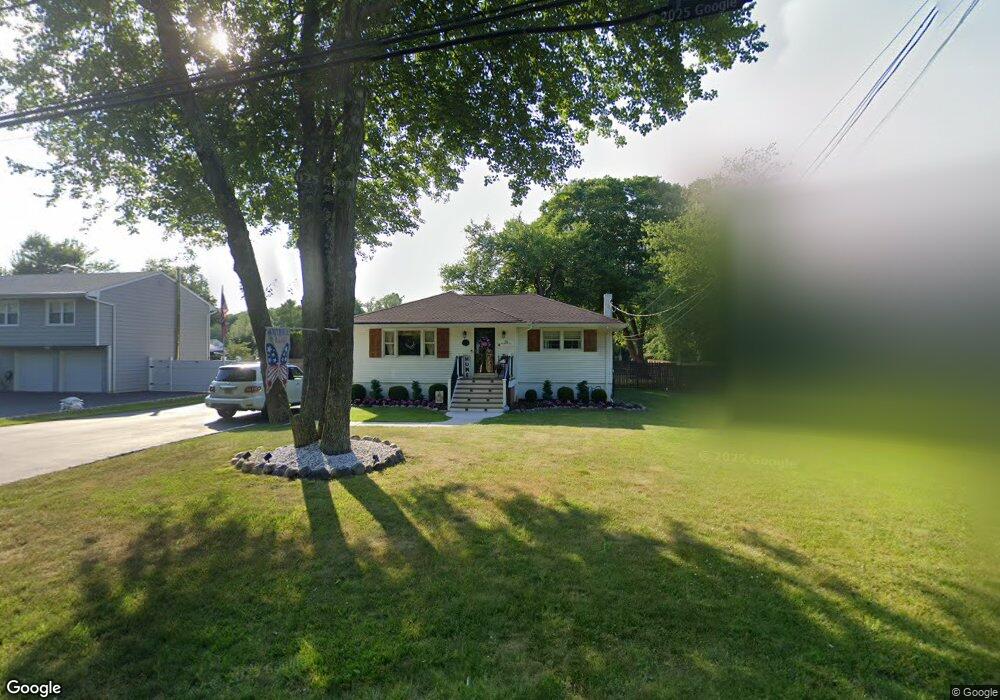
38 Maple St Old Bridge, NJ 08857
Estimated Value: $498,422 - $594,000
3
Beds
1
Bath
1,332
Sq Ft
$417/Sq Ft
Est. Value
About This Home
This home is located at 38 Maple St, Old Bridge, NJ 08857 and is currently estimated at $555,106, approximately $416 per square foot. 38 Maple St is a home located in Middlesex County with nearby schools including Old Bridge High School, St. Thomas the Apostle School, and St. Ambrose School.
Ownership History
Date
Name
Owned For
Owner Type
Purchase Details
Closed on
May 15, 2008
Sold by
Mclean Edwin and Franks Debra
Bought by
Bullis Ian and Bullis Kelly A
Current Estimated Value
Home Financials for this Owner
Home Financials are based on the most recent Mortgage that was taken out on this home.
Original Mortgage
$318,600
Outstanding Balance
$202,084
Interest Rate
5.91%
Mortgage Type
Purchase Money Mortgage
Estimated Equity
$353,022
Purchase Details
Closed on
Apr 15, 1994
Sold by
Webb Frances
Bought by
Mclean Edwin and Mc Lean Debra
Home Financials for this Owner
Home Financials are based on the most recent Mortgage that was taken out on this home.
Original Mortgage
$133,000
Interest Rate
7.93%
Create a Home Valuation Report for This Property
The Home Valuation Report is an in-depth analysis detailing your home's value as well as a comparison with similar homes in the area
Home Values in the Area
Average Home Value in this Area
Purchase History
| Date | Buyer | Sale Price | Title Company |
|---|---|---|---|
| Bullis Ian | $354,000 | None Available | |
| Mclean Edwin | $141,000 | -- |
Source: Public Records
Mortgage History
| Date | Status | Borrower | Loan Amount |
|---|---|---|---|
| Open | Bullis Ian | $318,600 | |
| Previous Owner | Mclean Edwin | $133,000 |
Source: Public Records
Tax History
| Year | Tax Paid | Tax Assessment Tax Assessment Total Assessment is a certain percentage of the fair market value that is determined by local assessors to be the total taxable value of land and additions on the property. | Land | Improvement |
|---|---|---|---|---|
| 2025 | $7,878 | $139,500 | $65,400 | $74,100 |
| 2024 | $7,557 | $139,500 | $65,400 | $74,100 |
| 2023 | $7,557 | $139,500 | $65,400 | $74,100 |
| 2022 | $7,384 | $139,500 | $65,400 | $74,100 |
| 2021 | $5,419 | $139,500 | $65,400 | $74,100 |
| 2020 | $7,166 | $139,500 | $65,400 | $74,100 |
| 2019 | $7,045 | $139,500 | $65,400 | $74,100 |
| 2018 | $6,967 | $139,500 | $65,400 | $74,100 |
| 2017 | $6,741 | $139,500 | $65,400 | $74,100 |
| 2016 | $6,601 | $139,500 | $65,400 | $74,100 |
| 2015 | $6,487 | $139,500 | $65,400 | $74,100 |
| 2014 | $6,421 | $139,500 | $65,400 | $74,100 |
Source: Public Records
Map
Nearby Homes
- 35 Birch St
- 1800 New Jersey 18
- 1122 Marlboro Rd
- 0-0 By Palmer Bridge
- 21 Pine St
- 30 Arvin Rd
- 25 Morsell Place
- 45 Piersoll Rd
- 14 Andover Rd
- 1732 New Jersey 18
- 1299 Englishtown Rd
- 1283 Englishtown Rd
- 98 Madison Ave
- 132 Southwood Dr
- 815 Marlboro Rd
- 14 Brookside Ave
- 23 Orchard Dr
- 1210 Englishtown Rd
- 50 Creighton Cir
- 34 Brookside Ave
Your Personal Tour Guide
Ask me questions while you tour the home.