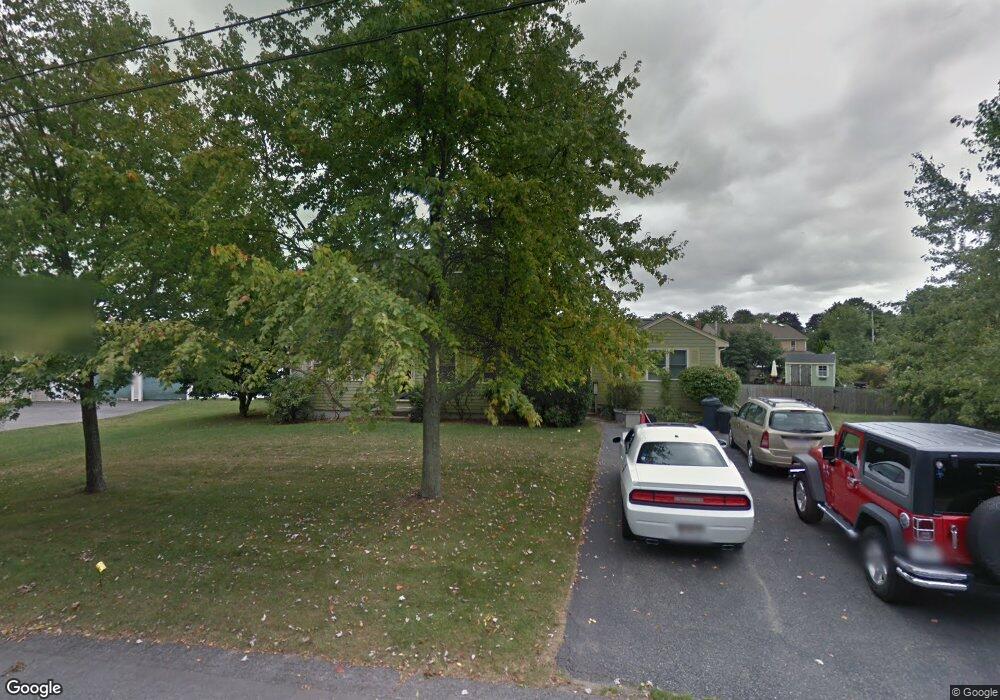
38 Marehaven Dr Seekonk, MA 02771
Estimated Value: $578,632 - $695,000
3
Beds
2
Baths
1,968
Sq Ft
$323/Sq Ft
Est. Value
About This Home
This home is located at 38 Marehaven Dr, Seekonk, MA 02771 and is currently estimated at $634,908, approximately $322 per square foot. 38 Marehaven Dr is a home located in Bristol County with nearby schools including Seekonk High School, The Gordon School, and St Mary Academy-Bay View.
Ownership History
Date
Name
Owned For
Owner Type
Purchase Details
Closed on
Aug 19, 1992
Sold by
Heritage Home Attlebro
Bought by
Halpin James F and Brown Donna A
Current Estimated Value
Home Financials for this Owner
Home Financials are based on the most recent Mortgage that was taken out on this home.
Original Mortgage
$100,000
Interest Rate
8.12%
Mortgage Type
Purchase Money Mortgage
Create a Home Valuation Report for This Property
The Home Valuation Report is an in-depth analysis detailing your home's value as well as a comparison with similar homes in the area
Home Values in the Area
Average Home Value in this Area
Purchase History
| Date | Buyer | Sale Price | Title Company |
|---|---|---|---|
| Halpin James F | $137,900 | -- |
Source: Public Records
Mortgage History
| Date | Status | Borrower | Loan Amount |
|---|---|---|---|
| Open | Halpin James F | $61,182 | |
| Closed | Halpin James F | $97,300 | |
| Closed | Halpin James F | $100,000 |
Source: Public Records
Tax History
| Year | Tax Paid | Tax Assessment Tax Assessment Total Assessment is a certain percentage of the fair market value that is determined by local assessors to be the total taxable value of land and additions on the property. | Land | Improvement |
|---|---|---|---|---|
| 2025 | $5,351 | $433,300 | $165,200 | $268,100 |
| 2024 | $5,131 | $415,500 | $165,200 | $250,300 |
| 2023 | $5,015 | $382,500 | $147,800 | $234,700 |
| 2022 | $4,561 | $341,900 | $141,700 | $200,200 |
| 2021 | $4,361 | $321,400 | $125,500 | $195,900 |
| 2020 | $4,238 | $321,800 | $125,800 | $196,000 |
| 2019 | $4,075 | $312,000 | $125,800 | $186,200 |
| 2018 | $4,088 | $306,200 | $125,800 | $180,400 |
| 2017 | $3,893 | $289,200 | $120,400 | $168,800 |
| 2016 | $3,853 | $287,300 | $120,400 | $166,900 |
| 2015 | $3,769 | $284,900 | $120,400 | $164,500 |
Source: Public Records
Map
Nearby Homes
- 11 Hawthorne Dr
- 0 N Wheaton Ave
- 57 Mohawk Dr
- 8 Agawam Ct
- 454 Fall River Ave
- 0 Wheaton Ave
- 30 Fuller St
- 205 Providence St Bldr Lot 3
- 203 Providence St Bldr Lot 5
- 195 Barney Ave
- 34 Palmer River Rd
- 7 Jill Ct
- 127 Mason St
- 67 Wheeler St
- 296 Fall River Ave
- 134 Mason St
- 0 Milton St Unit 72633661
- 65 Estrell Dr
- 106 Wannamoisett Rd
- 3 Pine Top Rd
Your Personal Tour Guide
Ask me questions while you tour the home.