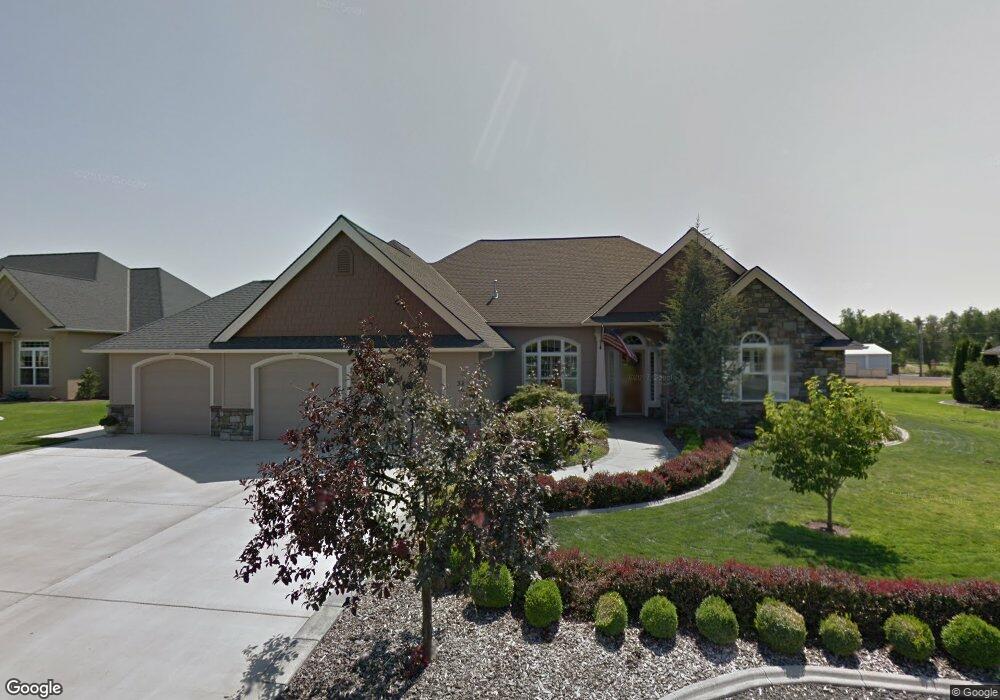
38 Marilyn Ln Walla Walla, WA 99362
Estimated Value: $645,000 - $1,013,000
5
Beds
3
Baths
3,344
Sq Ft
$246/Sq Ft
Est. Value
About This Home
This home is located at 38 Marilyn Ln, Walla Walla, WA 99362 and is currently estimated at $822,443, approximately $245 per square foot. 38 Marilyn Ln is a home located in Walla Walla County with nearby schools including Davis Elementary School, John Sager Middle School, and Liberty Christian School.
Ownership History
Date
Name
Owned For
Owner Type
Purchase Details
Closed on
Oct 19, 2020
Sold by
Owens Mary F
Bought by
Drake Michele R and Drake Loren P
Current Estimated Value
Home Financials for this Owner
Home Financials are based on the most recent Mortgage that was taken out on this home.
Original Mortgage
$510,400
Outstanding Balance
$453,974
Interest Rate
2.9%
Mortgage Type
New Conventional
Estimated Equity
$368,469
Purchase Details
Closed on
Oct 16, 2020
Sold by
Shugars Shawn and Shugars Dina
Bought by
Owens Mary F
Home Financials for this Owner
Home Financials are based on the most recent Mortgage that was taken out on this home.
Original Mortgage
$510,400
Outstanding Balance
$453,974
Interest Rate
2.9%
Mortgage Type
New Conventional
Estimated Equity
$368,469
Purchase Details
Closed on
Jul 2, 2009
Sold by
Whispering Meadow Llc
Bought by
Owens Gerald F and Owens Mary F
Home Financials for this Owner
Home Financials are based on the most recent Mortgage that was taken out on this home.
Original Mortgage
$350,000
Interest Rate
4.79%
Mortgage Type
Purchase Money Mortgage
Create a Home Valuation Report for This Property
The Home Valuation Report is an in-depth analysis detailing your home's value as well as a comparison with similar homes in the area
Home Values in the Area
Average Home Value in this Area
Purchase History
| Date | Buyer | Sale Price | Title Company |
|---|---|---|---|
| Drake Michele R | $649,000 | Titleone | |
| Owens Mary F | $464,000 | Title One | |
| Owens Gerald F | $470,000 | Lt |
Source: Public Records
Mortgage History
| Date | Status | Borrower | Loan Amount |
|---|---|---|---|
| Open | Drake Michele R | $510,400 | |
| Closed | Owens Mary F | $293,500 | |
| Previous Owner | Owens Gerald F | $350,000 |
Source: Public Records
Tax History Compared to Growth
Tax History
| Year | Tax Paid | Tax Assessment Tax Assessment Total Assessment is a certain percentage of the fair market value that is determined by local assessors to be the total taxable value of land and additions on the property. | Land | Improvement |
|---|---|---|---|---|
| 2024 | $7,878 | $661,190 | $130,000 | $531,190 |
| 2023 | $7,878 | $661,190 | $130,000 | $531,190 |
| 2022 | $8,441 | $661,190 | $130,000 | $531,190 |
| 2021 | $7,703 | $635,900 | $130,000 | $505,900 |
| 2020 | $8,165 | $504,740 | $130,000 | $374,740 |
| 2019 | $7,459 | $504,740 | $75,000 | $429,740 |
| 2018 | $7,701 | $484,270 | $75,000 | $409,270 |
| 2017 | $7,776 | $484,270 | $75,000 | $409,270 |
| 2016 | $7,586 | $484,270 | $75,000 | $409,270 |
| 2015 | $8,385 | $464,790 | $75,000 | $389,790 |
| 2014 | -- | $485,300 | $75,000 | $410,300 |
| 2013 | -- | $485,300 | $75,000 | $410,300 |
Source: Public Records
Map
Nearby Homes
- 609 W Whitman Dr
- 314 SW Homestead Ave
- 1254 SW Settlement St
- 136 Blalock Dr
- 28 SW Evans Ave
- 604 SW 4th St
- 1450 SW Greeley St
- 247 NW Laurella Ln
- 919 Stanley Dr
- 220 Blalock Dr
- 960 Brickner Rd
- 40 NW B St
- 1078 Clarence Ave
- 70 NE Rose St
- 123 NE C St
- 214 E Whitman Dr
- 218 E Whitman Dr
- 210 SE 4th St
- 226 E Whitman Dr
- 316 SW 12th St
- 52 Marilyn Ln
- 41 Marilyn Ln
- 986 W Whitman Dr
- 962 W Whitman Dr
- 21 Marilyn Ln
- 64 Marilyn Ln
- 61 Marilyn Ln
- 1220 S Campbell Rd
- 924 W Whitman Dr
- 102 Linda Ln
- 99 Linda Ln
- 898 W Whitman Dr
- 1157 Campbell Rd
- 96 Linda Ln
- 957 W Whitman Dr
- 927 W Whitman Dr
- 1103 S Campbell Rd
- 850 W Whitman Dr
- 64 Linda Ln
- 1124 S Campbell Rd