38 Marlin Ln Unit B Key Largo, FL 33037
North Key Largo NeighborhoodEstimated Value: $5,498,869 - $5,885,000
4
Beds
3
Baths
2,198
Sq Ft
$2,578/Sq Ft
Est. Value
About This Home
This home is located at 38 Marlin Ln Unit B, Key Largo, FL 33037 and is currently estimated at $5,667,217, approximately $2,578 per square foot. 38 Marlin Ln Unit B is a home located in Monroe County with nearby schools including Key Largo School and Coral Shores High School.
Ownership History
Date
Name
Owned For
Owner Type
Purchase Details
Closed on
Nov 14, 2025
Sold by
Mancosh Doug and Kathy S Mancosh Revocable Trust
Bought by
Brown Brooks R and Brown Jennifer B
Current Estimated Value
Purchase Details
Closed on
Apr 1, 2021
Sold by
Shields Patrick and Shields Margaret
Bought by
Mancosh Doug and Mancosh Kathy S
Purchase Details
Closed on
Oct 9, 2011
Sold by
Murray Robert J and Robert J Murray Family Trust
Bought by
Rushmore Julia K
Purchase Details
Closed on
May 11, 2009
Sold by
Murray Robert J
Bought by
Murray Robert J and The Robert J Murray 2008 Revoc
Purchase Details
Closed on
Nov 14, 2004
Sold by
Newton David G
Bought by
Murray Robert J
Purchase Details
Closed on
Jan 28, 2000
Bought by
Rushmore Julia K
Purchase Details
Closed on
Apr 1, 1989
Bought by
Rushmore Julia K
Purchase Details
Closed on
Dec 1, 1986
Bought by
Rushmore Julia K
Purchase Details
Closed on
Feb 1, 1974
Bought by
Rushmore Julia K
Create a Home Valuation Report for This Property
The Home Valuation Report is an in-depth analysis detailing your home's value as well as a comparison with similar homes in the area
Home Values in the Area
Average Home Value in this Area
Purchase History
| Date | Buyer | Sale Price | Title Company |
|---|---|---|---|
| Brown Brooks R | $5,800,000 | Reef Title | |
| Mancosh Doug | $3,700,000 | Reef Title Company Llc | |
| Kathy S Mancosh Revocable Trust | $3,700,000 | Reef Title | |
| Rushmore Julia K | $2,600,000 | Attorney | |
| Murray Robert J | -- | Attorney | |
| Murray Robert J | $763,000 | -- | |
| Rushmore Julia K | $703,000 | -- | |
| Rushmore Julia K | $310,000 | -- | |
| Rushmore Julia K | $240,000 | -- | |
| Rushmore Julia K | $87,000 | -- |
Source: Public Records
Tax History
| Year | Tax Paid | Tax Assessment Tax Assessment Total Assessment is a certain percentage of the fair market value that is determined by local assessors to be the total taxable value of land and additions on the property. | Land | Improvement |
|---|---|---|---|---|
| 2025 | $33,321 | $5,292,624 | -- | $5,292,624 |
| 2024 | $29,811 | $5,393,174 | -- | $5,393,174 |
| 2023 | $29,811 | $4,625,797 | $0 | $4,625,797 |
| 2022 | $25,373 | $3,746,720 | $0 | $3,746,720 |
| 2021 | $18,395 | $2,527,855 | $0 | $2,527,855 |
| 2020 | $13,943 | $1,926,381 | $0 | $1,926,381 |
| 2019 | $13,651 | $1,883,071 | $0 | $1,883,071 |
| 2018 | $13,699 | $1,847,960 | $0 | $0 |
| 2017 | $13,392 | $1,809,952 | $0 | $0 |
| 2016 | $13,830 | $1,772,725 | $0 | $0 |
| 2015 | $14,116 | $1,760,402 | $0 | $0 |
| 2014 | $16,287 | $1,967,538 | $0 | $0 |
Source: Public Records
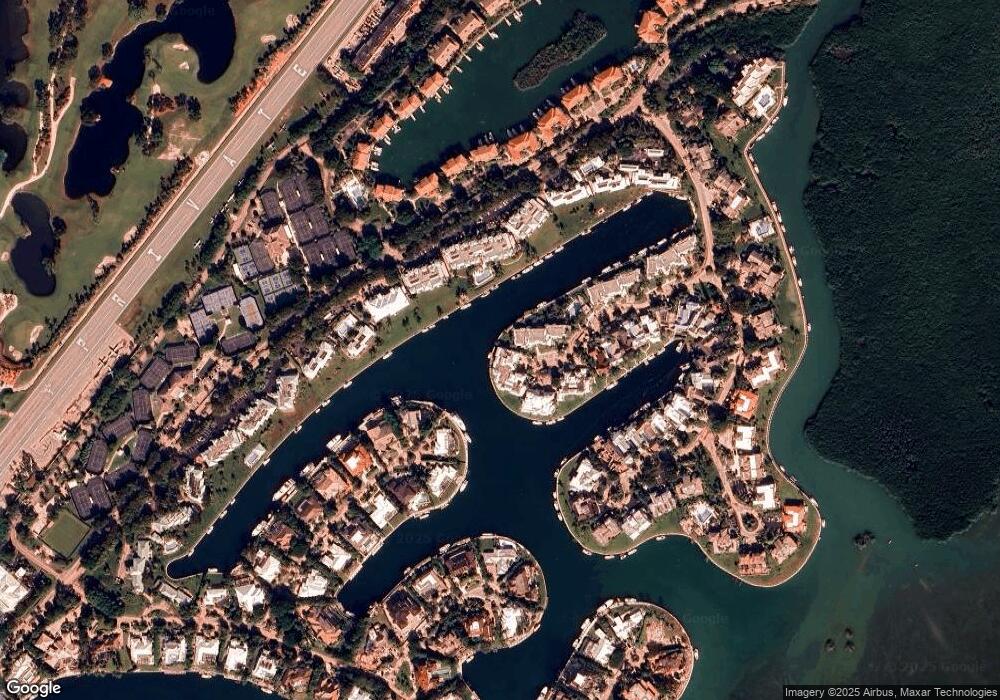
Map
Nearby Homes
- 26 Marlin Ln Unit B
- 64 Tarpon Ln
- 18 Anchor Dr Unit B
- 10 Cannon Point
- 44 Card Sound Rd
- 22 S South Island Dr Dr
- 22 S Island Dr
- 365 S Harbor Dr
- 31 S Carysfort Cir
- 0 167th & Card Sound Rd Unit F10511744
- 500 Burton Dr Unit 3310
- 500 Burton Dr Unit 1314
- 0 NW 0 Unit A11935439
- 0 NW 0 Unit A11794670
- 0 NW 0 Unit A11956672
- 0 NW 0 Unit A11935466
- 410xx SW 122 Ave
- 400xx SW 122 Ave
- 0 Unit 616391
- 133 Valois Blvd
- 40 Marlin Ln Unit B
- 40 Marlin Ln Unit A
- 42 Marlin Ln Unit A
- 44 Marlin Ln Unit B
- 42 Marlin Ln Unit B
- 38 Marlin Ln Unit A
- 44 Marlin Ln Unit A
- 36 Marlin Ln Unit PC36A
- 36 Marlin Ln Unit B
- 48 Marlin Ln Unit A
- 48 Marlin Ln Unit B
- 48 Marlin Ln Unit A
- 46 Marlin Ln
- 46 Marlin Ln Unit B
- 46 Marlin Ln Unit A
- 30 Marlin Ln Unit B
- 34 Marlin Ln Unit A
- 30 Marlin Ln Unit B
- 32 Marlin Ln Unit B
- 34 Marlin Ln Unit B
Your Personal Tour Guide
Ask me questions while you tour the home.