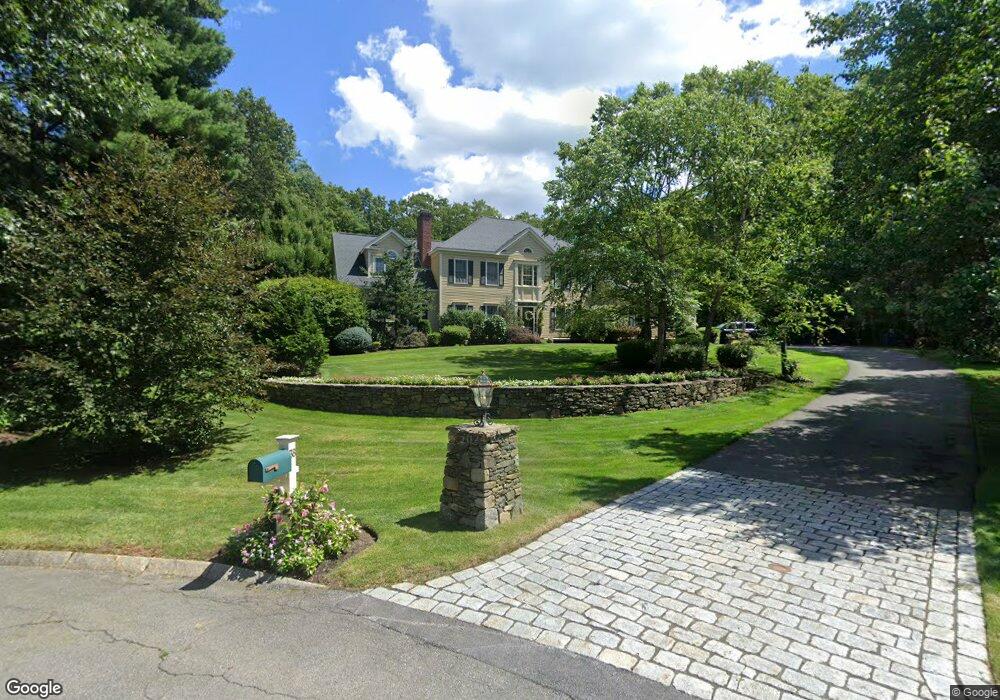
38 Martin Dr Sudbury, MA 01776
Estimated Value: $1,597,000 - $2,118,000
4
Beds
4
Baths
5,011
Sq Ft
$365/Sq Ft
Est. Value
About This Home
This home is located at 38 Martin Dr, Sudbury, MA 01776 and is currently estimated at $1,831,214, approximately $365 per square foot. 38 Martin Dr is a home located in Middlesex County with nearby schools including General John Nixon Elementary School, Ephraim Curtis Middle School, and Lincoln-Sudbury Regional High School.
Ownership History
Date
Name
Owned For
Owner Type
Purchase Details
Closed on
Dec 17, 2008
Sold by
Tocci Diane A and Tocci Paul L
Bought by
Tocci Diane A
Current Estimated Value
Create a Home Valuation Report for This Property
The Home Valuation Report is an in-depth analysis detailing your home's value as well as a comparison with similar homes in the area
Home Values in the Area
Average Home Value in this Area
Purchase History
| Date | Buyer | Sale Price | Title Company |
|---|---|---|---|
| Tocci Diane A | -- | -- |
Source: Public Records
Tax History
| Year | Tax Paid | Tax Assessment Tax Assessment Total Assessment is a certain percentage of the fair market value that is determined by local assessors to be the total taxable value of land and additions on the property. | Land | Improvement |
|---|---|---|---|---|
| 2025 | $28,121 | $1,920,800 | $506,400 | $1,414,400 |
| 2024 | $27,020 | $1,849,400 | $492,000 | $1,357,400 |
| 2023 | $24,798 | $1,572,500 | $440,000 | $1,132,500 |
| 2022 | $23,470 | $1,300,300 | $404,000 | $896,300 |
| 2021 | $22,513 | $1,195,600 | $404,000 | $791,600 |
| 2020 | $22,059 | $1,195,600 | $404,000 | $791,600 |
| 2019 | $21,413 | $1,195,600 | $404,000 | $791,600 |
| 2018 | $20,612 | $1,149,600 | $429,600 | $720,000 |
| 2017 | $20,202 | $1,138,800 | $426,000 | $712,800 |
| 2016 | $19,263 | $1,082,200 | $410,000 | $672,200 |
| 2015 | $18,598 | $1,056,700 | $398,400 | $658,300 |
| 2014 | $18,591 | $1,031,100 | $386,800 | $644,300 |
Source: Public Records
Map
Nearby Homes
- 111 Willis Rd
- 62 Churchill St
- 11 October Rd
- 55 Widow Rites Ln
- 45 Widow Rites Ln
- 45 Webster Cir
- 427 Concord Rd
- 30 Harness Ln
- 557 Dutton Rd Unit 2
- 15 Harness Ln
- 46 Brewster Rd
- 11 Great Lake Dr
- 26 Clark Rd
- 30 Kendall Rd
- 377 Willis Rd
- 53 Pine St
- 30 Rolling Ln
- 8-10 Concord Road (&356 Bostonpost)
- 57 Longfellow Rd
- 11 Farmstead Ln Unit 11
Your Personal Tour Guide
Ask me questions while you tour the home.