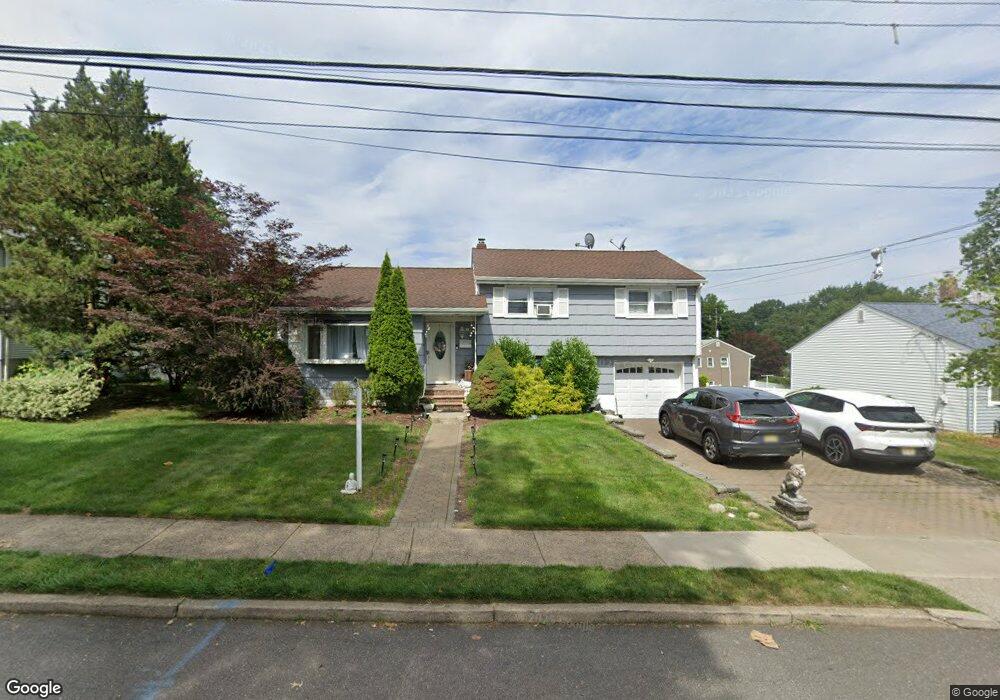
38 Medford Rd Dumont, NJ 07628
Estimated Value: $698,000 - $732,000
--
Bed
--
Bath
1,615
Sq Ft
$440/Sq Ft
Est. Value
About This Home
This home is located at 38 Medford Rd, Dumont, NJ 07628 and is currently estimated at $710,897, approximately $440 per square foot. 38 Medford Rd is a home located in Bergen County with nearby schools including Dumont High School.
Ownership History
Date
Name
Owned For
Owner Type
Purchase Details
Closed on
Oct 9, 2024
Sold by
Nasef Olfat G and Rahman Ismail
Bought by
Rahman Ismail and Nasef Olfat G
Current Estimated Value
Purchase Details
Closed on
Jul 25, 2013
Sold by
Nasef Galal O
Bought by
Nasef Olfat G
Purchase Details
Closed on
Sep 6, 2002
Sold by
Nonas Peter J
Bought by
Nasef Olfat G
Home Financials for this Owner
Home Financials are based on the most recent Mortgage that was taken out on this home.
Original Mortgage
$120,000
Interest Rate
6.36%
Purchase Details
Closed on
May 3, 1994
Sold by
Nakarani Dhirajlal and Nakarani Kantaben
Bought by
Nonas Peter
Create a Home Valuation Report for This Property
The Home Valuation Report is an in-depth analysis detailing your home's value as well as a comparison with similar homes in the area
Home Values in the Area
Average Home Value in this Area
Purchase History
| Date | Buyer | Sale Price | Title Company |
|---|---|---|---|
| Rahman Ismail | -- | None Listed On Document | |
| Rahman Ismail | -- | None Listed On Document | |
| Rahman Ismail | -- | None Listed On Document | |
| Nasef Olfat G | -- | -- | |
| Nasef Olfat G | $360,000 | -- | |
| Nonas Peter | $195,000 | -- |
Source: Public Records
Mortgage History
| Date | Status | Borrower | Loan Amount |
|---|---|---|---|
| Previous Owner | Nasef Olfat G | $120,000 |
Source: Public Records
Tax History Compared to Growth
Tax History
| Year | Tax Paid | Tax Assessment Tax Assessment Total Assessment is a certain percentage of the fair market value that is determined by local assessors to be the total taxable value of land and additions on the property. | Land | Improvement |
|---|---|---|---|---|
| 2025 | $13,593 | $605,300 | $335,000 | $270,300 |
| 2024 | $13,259 | $334,400 | $180,000 | $154,400 |
| 2023 | $12,985 | $334,400 | $180,000 | $154,400 |
| 2022 | $12,985 | $334,400 | $180,000 | $154,400 |
| 2021 | $12,013 | $334,400 | $180,000 | $154,400 |
| 2020 | $12,570 | $334,400 | $180,000 | $154,400 |
| 2019 | $12,269 | $334,400 | $180,000 | $154,400 |
| 2018 | $12,018 | $334,400 | $180,000 | $154,400 |
| 2017 | $11,788 | $334,400 | $180,000 | $154,400 |
| 2016 | $11,513 | $334,400 | $180,000 | $154,400 |
| 2015 | $11,249 | $334,400 | $180,000 | $154,400 |
| 2014 | $11,029 | $334,400 | $180,000 | $154,400 |
Source: Public Records
Map
Nearby Homes