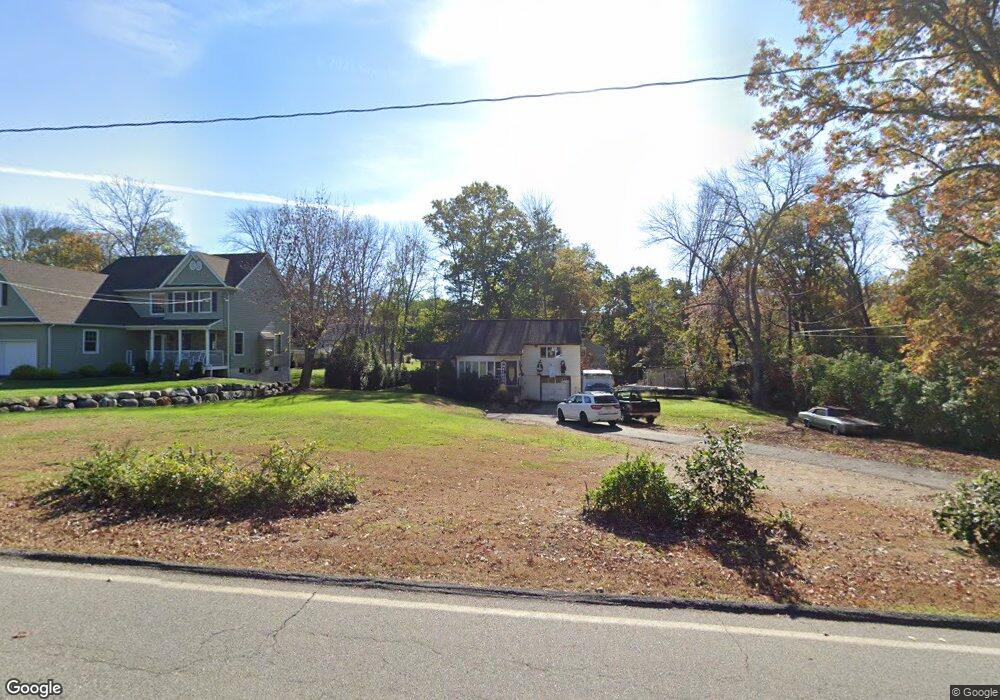
38 Meriden Rd Rockaway, NJ 07866
Estimated Value: $501,905 - $603,000
--
Bed
--
Bath
1,572
Sq Ft
$354/Sq Ft
Est. Value
About This Home
This home is located at 38 Meriden Rd, Rockaway, NJ 07866 and is currently estimated at $555,726, approximately $353 per square foot. 38 Meriden Rd is a home with nearby schools including Katherine D. Malone School, Copeland Middle School, and Divine Mercy Academy.
Ownership History
Date
Name
Owned For
Owner Type
Purchase Details
Closed on
Feb 27, 2007
Sold by
Mcgreevy Robert B and Mc Greevy Kimberly T
Bought by
Mcgreevy Robert B and Mc Greevy Kimberly T
Current Estimated Value
Purchase Details
Closed on
Nov 25, 1998
Sold by
Sabatino Casper and Sabatino Marie
Bought by
Mcgreevy Robert B and Mcgreevy Kimberly T
Home Financials for this Owner
Home Financials are based on the most recent Mortgage that was taken out on this home.
Original Mortgage
$160,000
Outstanding Balance
$35,062
Interest Rate
6.37%
Estimated Equity
$520,664
Create a Home Valuation Report for This Property
The Home Valuation Report is an in-depth analysis detailing your home's value as well as a comparison with similar homes in the area
Home Values in the Area
Average Home Value in this Area
Purchase History
| Date | Buyer | Sale Price | Title Company |
|---|---|---|---|
| Mcgreevy Robert B | -- | None Available | |
| Mcgreevy Robert B | $173,000 | -- |
Source: Public Records
Mortgage History
| Date | Status | Borrower | Loan Amount |
|---|---|---|---|
| Open | Mcgreevy Robert B | $160,000 |
Source: Public Records
Tax History Compared to Growth
Tax History
| Year | Tax Paid | Tax Assessment Tax Assessment Total Assessment is a certain percentage of the fair market value that is determined by local assessors to be the total taxable value of land and additions on the property. | Land | Improvement |
|---|---|---|---|---|
| 2025 | $8,638 | $366,700 | $214,300 | $152,400 |
| 2024 | $8,347 | $336,900 | $192,900 | $144,000 |
| 2023 | $8,347 | $318,100 | $181,800 | $136,300 |
| 2022 | $8,190 | $306,100 | $176,100 | $130,000 |
| 2021 | $8,190 | $288,600 | $164,300 | $124,300 |
| 2020 | $8,051 | $283,400 | $161,900 | $121,500 |
| 2019 | $7,889 | $276,500 | $157,100 | $119,400 |
| 2018 | $8,396 | $289,600 | $175,100 | $114,500 |
| 2017 | $8,501 | $272,300 | $162,100 | $110,200 |
| 2016 | $8,392 | $272,300 | $162,100 | $110,200 |
| 2015 | $8,332 | $272,300 | $162,100 | $110,200 |
| 2014 | $8,177 | $272,300 | $162,100 | $110,200 |
Source: Public Records
Map
Nearby Homes