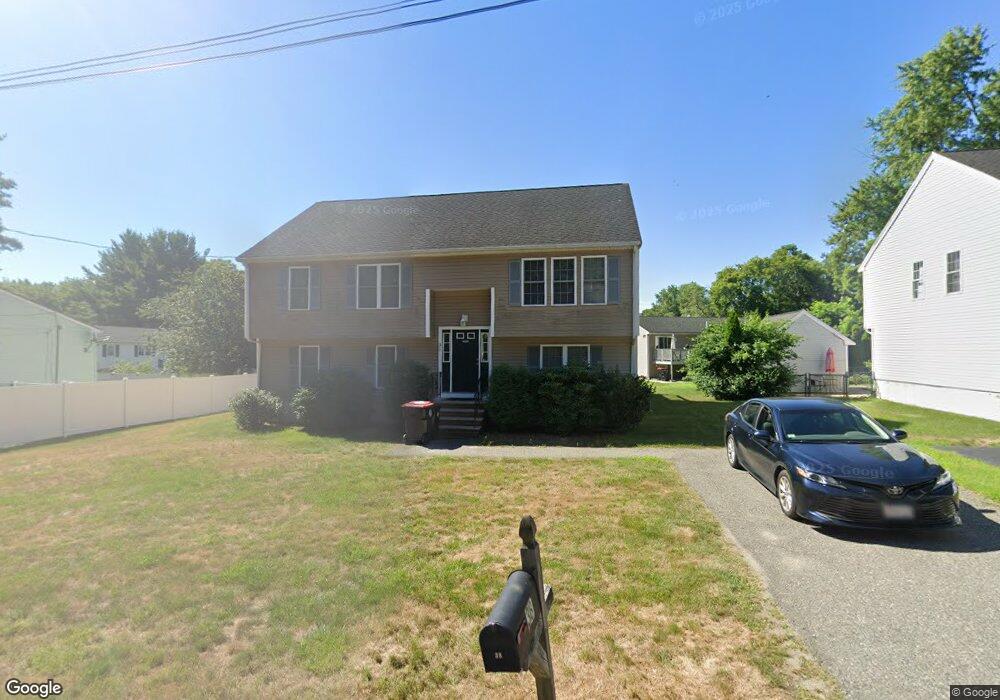
38 Moody St Brockton, MA 02302
Estimated Value: $526,000 - $689,000
4
Beds
3
Baths
2,352
Sq Ft
$270/Sq Ft
Est. Value
About This Home
This home is located at 38 Moody St, Brockton, MA 02302 and is currently estimated at $635,778, approximately $270 per square foot. 38 Moody St is a home located in Plymouth County with nearby schools including Arnone Elementary School, Joseph F. Plouffe Middle School, and Brockton Area Seventh-Day Adventist Academy.
Ownership History
Date
Name
Owned For
Owner Type
Purchase Details
Closed on
Aug 21, 2009
Sold by
M Ferrone Constr Inc
Bought by
Noia John C
Current Estimated Value
Home Financials for this Owner
Home Financials are based on the most recent Mortgage that was taken out on this home.
Original Mortgage
$224,000
Outstanding Balance
$145,900
Interest Rate
5.19%
Mortgage Type
Purchase Money Mortgage
Estimated Equity
$489,878
Purchase Details
Closed on
Jan 15, 2009
Sold by
Haikal George A
Bought by
Michael Ferrone Inc
Create a Home Valuation Report for This Property
The Home Valuation Report is an in-depth analysis detailing your home's value as well as a comparison with similar homes in the area
Home Values in the Area
Average Home Value in this Area
Purchase History
| Date | Buyer | Sale Price | Title Company |
|---|---|---|---|
| Noia John C | $280,000 | -- | |
| Michael Ferrone Inc | $274,600 | -- |
Source: Public Records
Mortgage History
| Date | Status | Borrower | Loan Amount |
|---|---|---|---|
| Open | Michael Ferrone Inc | $224,000 | |
| Previous Owner | Michael Ferrone Inc | $225,000 |
Source: Public Records
Tax History Compared to Growth
Tax History
| Year | Tax Paid | Tax Assessment Tax Assessment Total Assessment is a certain percentage of the fair market value that is determined by local assessors to be the total taxable value of land and additions on the property. | Land | Improvement |
|---|---|---|---|---|
| 2025 | $6,786 | $560,400 | $140,200 | $420,200 |
| 2024 | $6,712 | $558,400 | $140,200 | $418,200 |
| 2023 | $6,080 | $468,400 | $105,000 | $363,400 |
| 2022 | $5,735 | $410,500 | $95,500 | $315,000 |
| 2021 | $5,433 | $374,700 | $79,400 | $295,300 |
| 2020 | $5,249 | $346,500 | $74,300 | $272,200 |
| 2019 | $5,164 | $332,300 | $72,400 | $259,900 |
| 2018 | $4,828 | $300,600 | $72,400 | $228,200 |
| 2017 | $4,494 | $279,100 | $72,400 | $206,700 |
| 2016 | $4,540 | $261,500 | $70,200 | $191,300 |
| 2015 | $4,686 | $258,200 | $70,200 | $188,000 |
| 2014 | $4,485 | $247,400 | $70,200 | $177,200 |
Source: Public Records
Map
Nearby Homes