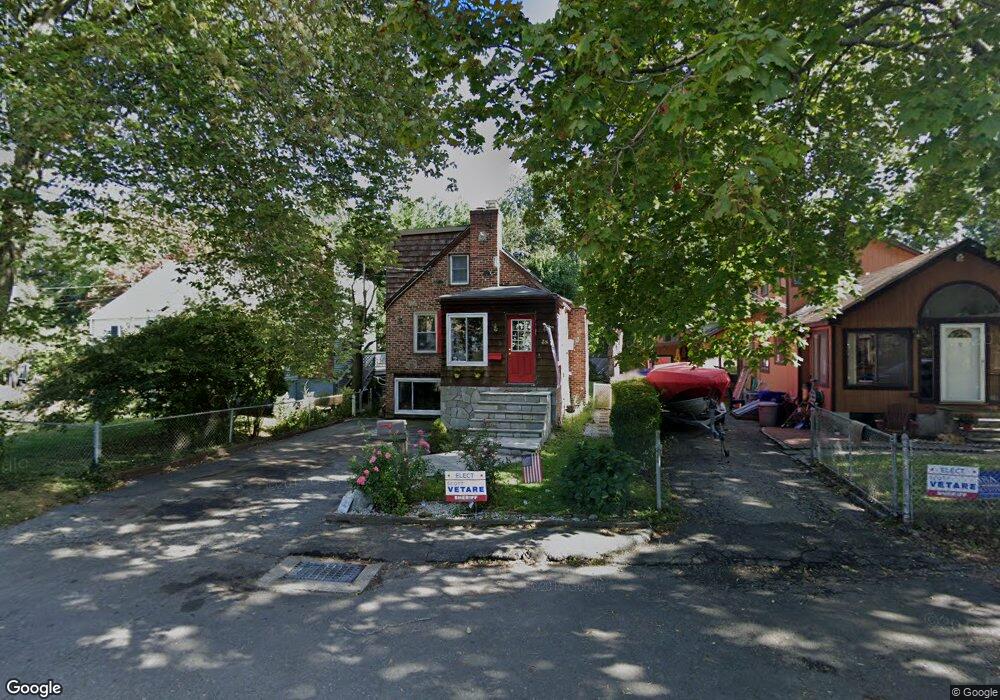
38 N Bridge St Norwalk, CT 06855
East Norwalk NeighborhoodEstimated Value: $561,000 - $651,000
3
Beds
2
Baths
1,050
Sq Ft
$572/Sq Ft
Est. Value
About This Home
This home is located at 38 N Bridge St, Norwalk, CT 06855 and is currently estimated at $600,452, approximately $571 per square foot. 38 N Bridge St is a home located in Fairfield County with nearby schools including Marvin Elementary School, Nathan Hale Middle School, and Norwalk High School.
Ownership History
Date
Name
Owned For
Owner Type
Purchase Details
Closed on
Jun 28, 2004
Sold by
Qualman Gene
Bought by
Guzman Rodrigo A and Guzman Angela Y
Current Estimated Value
Purchase Details
Closed on
May 17, 2000
Sold by
Destro Ron Song
Bought by
Bray Peter
Purchase Details
Closed on
Jul 31, 1996
Sold by
Faucher Gary and Faucher Laurie
Bought by
Destro Ronnie and Song-Destro Siqing
Create a Home Valuation Report for This Property
The Home Valuation Report is an in-depth analysis detailing your home's value as well as a comparison with similar homes in the area
Home Values in the Area
Average Home Value in this Area
Purchase History
| Date | Buyer | Sale Price | Title Company |
|---|---|---|---|
| Guzman Rodrigo A | $370,000 | -- | |
| Guzman Rodrigo A | $370,000 | -- | |
| Bray Peter | $160,000 | -- | |
| Bray Peter | $160,000 | -- | |
| Destro Ronnie | $126,000 | -- | |
| Destro Ronnie | $126,000 | -- |
Source: Public Records
Mortgage History
| Date | Status | Borrower | Loan Amount |
|---|---|---|---|
| Open | Destro Ronnie | $332,300 | |
| Closed | Destro Ronnie | $50,500 |
Source: Public Records
Tax History Compared to Growth
Tax History
| Year | Tax Paid | Tax Assessment Tax Assessment Total Assessment is a certain percentage of the fair market value that is determined by local assessors to be the total taxable value of land and additions on the property. | Land | Improvement |
|---|---|---|---|---|
| 2025 | $7,733 | $323,540 | $157,840 | $165,700 |
| 2024 | $7,618 | $323,540 | $157,840 | $165,700 |
| 2023 | $6,421 | $255,950 | $122,430 | $133,520 |
| 2022 | $6,282 | $255,950 | $122,430 | $133,520 |
| 2021 | $6,135 | $255,950 | $122,430 | $133,520 |
| 2020 | $6,132 | $255,950 | $122,430 | $133,520 |
| 2019 | $5,967 | $255,950 | $122,430 | $133,520 |
| 2018 | $5,334 | $200,470 | $103,820 | $96,650 |
| 2017 | $5,148 | $200,470 | $103,820 | $96,650 |
| 2016 | $5,131 | $201,680 | $103,820 | $97,860 |
| 2015 | $5,086 | $200,470 | $103,820 | $96,650 |
| 2014 | $5,020 | $200,470 | $103,820 | $96,650 |
Source: Public Records
Map
Nearby Homes
- 27 N Bridge St
- 1 Howard Ave Unit 2
- 20 Hayes Ave
- 118 Strawberry Hill Ave
- 42 Winfield St
- 17 Pequot Dr
- 6 Lyncrest Dr
- 189 East Ave
- 162 Strawberry Hill Ave
- 111 George Ave
- 8 Rolling Ln
- 1 1/2 Colony Place
- 18 Jenny Jenks Rd
- 18 Katy Ln
- 142 East Ave Unit A304
- 142 East Ave Unit A402
- 142 East Ave Unit A103
- 142 East Ave Unit 403
- 43 Gregory Blvd
- 72 Walter Ave