Estimated Value: $727,000 - $803,000
2
Beds
2
Baths
1,390
Sq Ft
$541/Sq Ft
Est. Value
About This Home
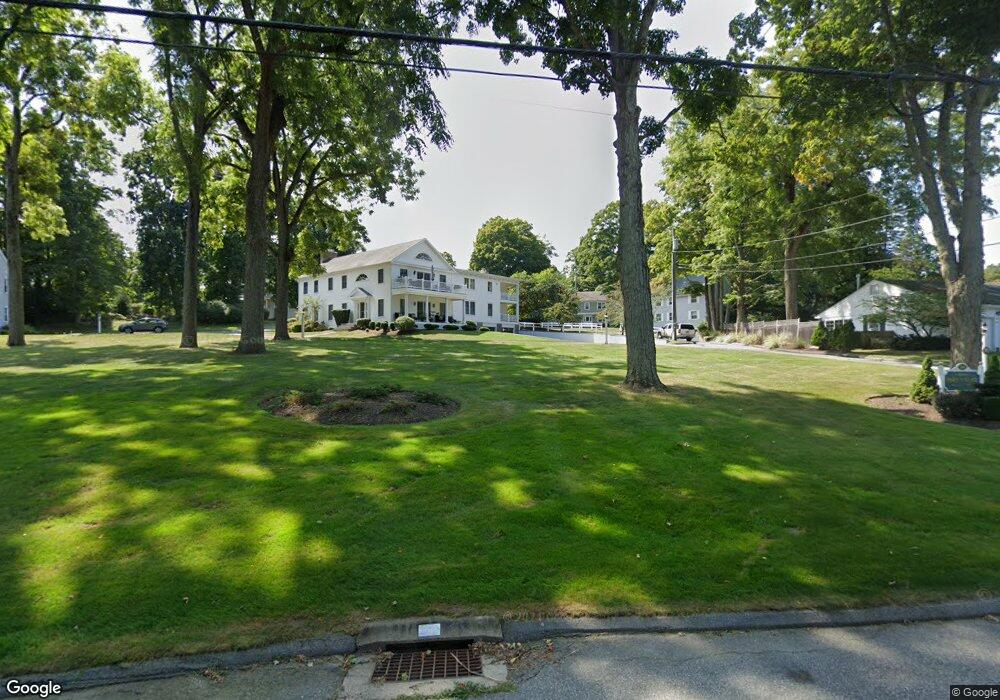
This home is located at 38 N Main St Unit 6, Essex, CT 06426 and is currently estimated at $751,433, approximately $540 per square foot. 38 N Main St Unit 6 is a home located in Middlesex County with nearby schools including Valley Regional High School and The Children's Tree Montessori.
Ownership History
Date
Name
Owned For
Owner Type
Purchase Details
Closed on
Jun 23, 2025
Sold by
Flynn Barbara G
Bought by
Bachman David and Bachman Ashley
Current Estimated Value
Home Financials for this Owner
Home Financials are based on the most recent Mortgage that was taken out on this home.
Original Mortgage
$588,000
Outstanding Balance
$586,476
Interest Rate
6.76%
Mortgage Type
Purchase Money Mortgage
Estimated Equity
$164,957
Purchase Details
Closed on
Nov 20, 2020
Sold by
Brown Christopher P
Bought by
Flynn Barbara G
Purchase Details
Closed on
Jul 20, 2015
Sold by
Craftsmen Llc
Bought by
Brown Christopher P
Home Financials for this Owner
Home Financials are based on the most recent Mortgage that was taken out on this home.
Original Mortgage
$400,000
Interest Rate
3.88%
Mortgage Type
New Conventional
Create a Home Valuation Report for This Property
The Home Valuation Report is an in-depth analysis detailing your home's value as well as a comparison with similar homes in the area
Home Values in the Area
Average Home Value in this Area
Purchase History
| Date | Buyer | Sale Price | Title Company |
|---|---|---|---|
| Bachman David | $735,000 | None Available | |
| Bachman David | $735,000 | None Available | |
| Flynn Barbara G | $435,000 | None Available | |
| Flynn Barbara G | $435,000 | None Available | |
| Brown Christopher P | $500,000 | -- | |
| Brown Christopher P | $500,000 | -- |
Source: Public Records
Mortgage History
| Date | Status | Borrower | Loan Amount |
|---|---|---|---|
| Open | Bachman David | $588,000 | |
| Closed | Bachman David | $588,000 | |
| Previous Owner | Brown Christopher P | $400,000 | |
| Previous Owner | Brown Christopher P | $50,000 |
Source: Public Records
Tax History Compared to Growth
Tax History
| Year | Tax Paid | Tax Assessment Tax Assessment Total Assessment is a certain percentage of the fair market value that is determined by local assessors to be the total taxable value of land and additions on the property. | Land | Improvement |
|---|---|---|---|---|
| 2025 | $7,992 | $429,000 | $0 | $429,000 |
| 2024 | $7,743 | $429,000 | $0 | $429,000 |
| 2023 | $7,629 | $337,700 | $0 | $337,700 |
| 2022 | $7,649 | $337,700 | $0 | $337,700 |
| 2021 | $7,680 | $342,400 | $0 | $342,400 |
| 2020 | $7,468 | $342,400 | $0 | $342,400 |
| 2019 | $7,413 | $342,400 | $0 | $342,400 |
| 2018 | $8,150 | $373,000 | $0 | $373,000 |
| 2017 | $8,191 | $373,000 | $0 | $373,000 |
| 2016 | $8,049 | $373,000 | $0 | $373,000 |
| 2015 | $7,863 | $373,000 | $0 | $373,000 |
| 2014 | -- | $373,000 | $0 | $373,000 |
Source: Public Records
Map
Nearby Homes
- 38 N Main St Unit 14
- 38 N Main St Unit 13
- 38 N Main St Unit 12
- 38 N Main St Unit 4
- 38 N Main St Unit 5
- 38 N Main St Unit 8
- 38 N Main St Unit 7
- 38 N Main St Unit 16
- 38 N Main St Unit 15
- 38 N Main St Unit 17
- 38 N Main St Unit 3
- 38 N Main St Unit 1
- 38 N Main St
- 42 N Main St
- 44 N Main St
- 7 High St
- 7 High St Unit UP
- 9 High St
- 44 N Main St
- 11 High St