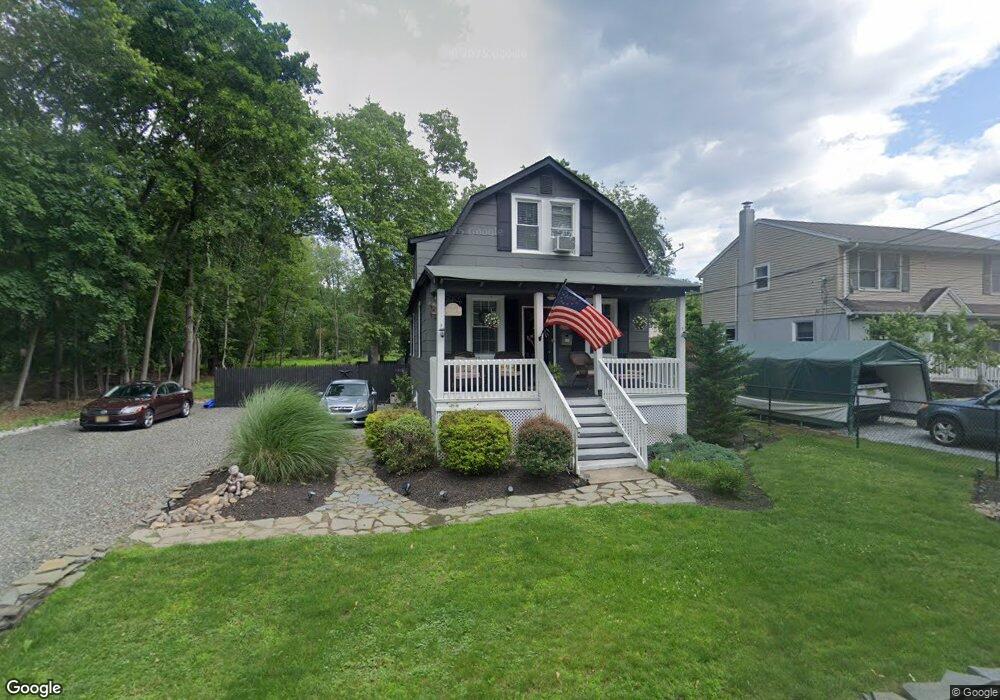
38 New Read St Pequannock, NJ 07440
Estimated Value: $425,000 - $510,000
--
Bed
--
Bath
1,276
Sq Ft
$363/Sq Ft
Est. Value
About This Home
This home is located at 38 New Read St, Pequannock, NJ 07440 and is currently estimated at $462,883, approximately $362 per square foot. 38 New Read St is a home located in Morris County with nearby schools including Pequannock Twp High School, Holy Spirit School, and Kolbe Immaculata School.
Ownership History
Date
Name
Owned For
Owner Type
Purchase Details
Closed on
Jul 18, 1996
Sold by
Dehart John
Bought by
Dixon Eugene F and Dixon Lynn
Current Estimated Value
Home Financials for this Owner
Home Financials are based on the most recent Mortgage that was taken out on this home.
Original Mortgage
$93,690
Outstanding Balance
$6,774
Interest Rate
8.24%
Estimated Equity
$456,109
Purchase Details
Closed on
May 24, 1996
Sold by
Calvetti Frank and Minogue Joan
Bought by
Dehart John
Home Financials for this Owner
Home Financials are based on the most recent Mortgage that was taken out on this home.
Original Mortgage
$93,690
Outstanding Balance
$6,774
Interest Rate
8.24%
Estimated Equity
$456,109
Create a Home Valuation Report for This Property
The Home Valuation Report is an in-depth analysis detailing your home's value as well as a comparison with similar homes in the area
Home Values in the Area
Average Home Value in this Area
Purchase History
| Date | Buyer | Sale Price | Title Company |
|---|---|---|---|
| Dixon Eugene F | $104,100 | -- | |
| Dehart John | $55,000 | Chicago Title Insurance Co |
Source: Public Records
Mortgage History
| Date | Status | Borrower | Loan Amount |
|---|---|---|---|
| Open | Dixon Eugene F | $93,690 |
Source: Public Records
Tax History Compared to Growth
Tax History
| Year | Tax Paid | Tax Assessment Tax Assessment Total Assessment is a certain percentage of the fair market value that is determined by local assessors to be the total taxable value of land and additions on the property. | Land | Improvement |
|---|---|---|---|---|
| 2025 | $6,349 | $372,400 | $261,800 | $110,600 |
| 2024 | $5,942 | $347,900 | $239,300 | $108,600 |
| 2023 | $5,942 | $323,300 | $216,800 | $106,500 |
| 2022 | $4,617 | $184,900 | $99,300 | $85,600 |
| 2021 | $4,617 | $184,900 | $99,300 | $85,600 |
| 2020 | $4,558 | $184,900 | $99,300 | $85,600 |
| 2019 | $4,410 | $184,900 | $99,300 | $85,600 |
| 2018 | $4,243 | $184,900 | $99,300 | $85,600 |
| 2017 | $4,107 | $184,900 | $99,300 | $85,600 |
| 2016 | $3,977 | $184,900 | $99,300 | $85,600 |
| 2015 | $3,959 | $184,900 | $99,300 | $85,600 |
| 2014 | $3,864 | $184,900 | $99,300 | $85,600 |
Source: Public Records
Map
Nearby Homes
- 38 Marlin Ave
- 7 1st St
- 43 Madison St
- 120 Greenwood Ave
- 00 Oakwood Ave
- 108 Boulevard
- 0 Oakwood Ave Unit 3989632
- 48 Caroline Ave
- 20 Newark Pompton Turnpike
- 48 Mandeville Ave
- 26 Voorhis Place
- 126 Jacksonville Rd
- 520 Newark Pompton Turnpike Unit C316
- 20 Knight Rd
- 2 Carol Place
- 26 Brookside Ave
- 107 Randolph St
- 31 Stephen Ave
- 4 Jeffrey Rd
- 111 Deerfield Rd