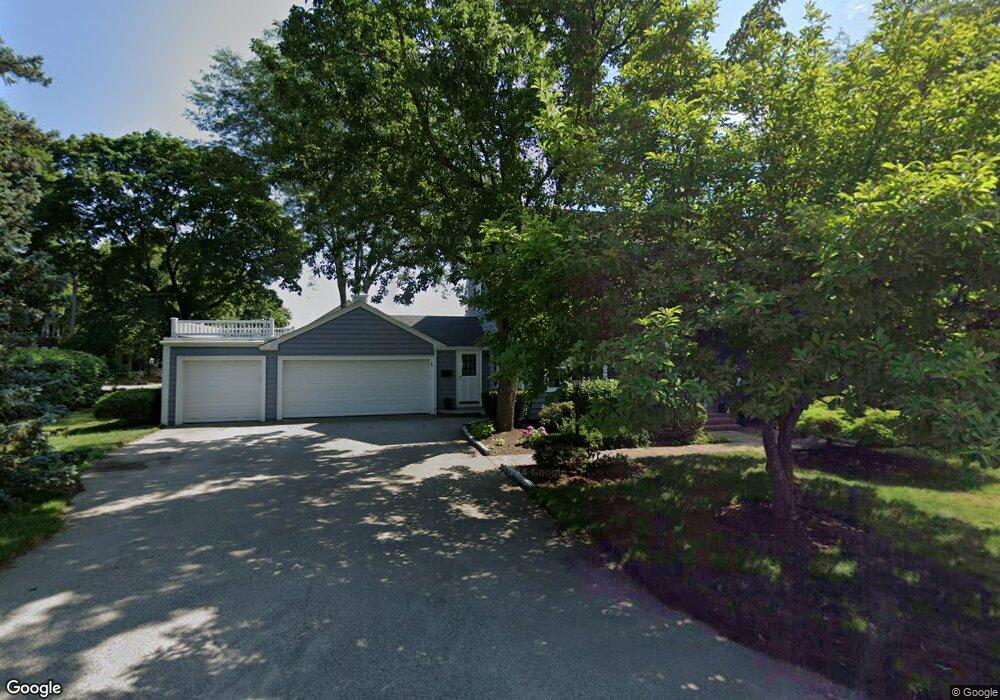
38 Newbert Ave South Weymouth, MA 02190
South Weymouth NeighborhoodEstimated Value: $743,000 - $816,000
4
Beds
3
Baths
2,032
Sq Ft
$384/Sq Ft
Est. Value
About This Home
This home is located at 38 Newbert Ave, South Weymouth, MA 02190 and is currently estimated at $779,865, approximately $383 per square foot. 38 Newbert Ave is a home located in Norfolk County with nearby schools including Thomas V Nash, Abigail Adams Middle School, and Weymouth Middle School Chapman.
Ownership History
Date
Name
Owned For
Owner Type
Purchase Details
Closed on
Dec 8, 1989
Sold by
Brandenburg Tr F H
Bought by
Fiander Steven J
Current Estimated Value
Home Financials for this Owner
Home Financials are based on the most recent Mortgage that was taken out on this home.
Original Mortgage
$180,000
Interest Rate
9.72%
Mortgage Type
Purchase Money Mortgage
Create a Home Valuation Report for This Property
The Home Valuation Report is an in-depth analysis detailing your home's value as well as a comparison with similar homes in the area
Home Values in the Area
Average Home Value in this Area
Purchase History
| Date | Buyer | Sale Price | Title Company |
|---|---|---|---|
| Fiander Steven J | $280,000 | -- |
Source: Public Records
Mortgage History
| Date | Status | Borrower | Loan Amount |
|---|---|---|---|
| Open | Fiander Steven J | $115,000 | |
| Closed | Fiander Steven J | $100,000 | |
| Closed | Fiander Steven J | $169,039 | |
| Closed | Fiander Steven J | $180,000 |
Source: Public Records
Tax History Compared to Growth
Tax History
| Year | Tax Paid | Tax Assessment Tax Assessment Total Assessment is a certain percentage of the fair market value that is determined by local assessors to be the total taxable value of land and additions on the property. | Land | Improvement |
|---|---|---|---|---|
| 2025 | $6,653 | $658,700 | $237,500 | $421,200 |
| 2024 | $6,548 | $637,600 | $226,200 | $411,400 |
| 2023 | $6,411 | $613,500 | $228,500 | $385,000 |
| 2022 | $6,232 | $543,800 | $211,600 | $332,200 |
| 2021 | $6,156 | $524,400 | $211,600 | $312,800 |
| 2020 | $5,902 | $495,100 | $211,600 | $283,500 |
| 2019 | $5,755 | $474,800 | $203,500 | $271,300 |
| 2018 | $5,566 | $445,300 | $193,800 | $251,500 |
| 2017 | $5,434 | $424,200 | $184,600 | $239,600 |
| 2016 | $5,239 | $409,300 | $177,500 | $231,800 |
| 2015 | $5,013 | $388,600 | $177,500 | $211,100 |
| 2014 | $4,801 | $361,000 | $165,200 | $195,800 |
Source: Public Records
Map
Nearby Homes
- 18 Fountain Ln Unit 2
- 120 Randolph St
- 45 Union St
- 50 Hollis St
- 27 Park Ave
- 60 Greentree Ln Unit 38
- 55 Greentree Ln Unit 19
- 193 Randolph St
- 211 Randolph St
- 261 Pleasant St Unit 3
- 261 Pleasant St Unit 5
- 2 Mitchell Ln Unit B
- 7 Woodcrest Ct Unit 4
- 25 Wales Ave
- 24 Fisher Rd
- 11 Woodcrest Ct Unit 5
- 10 Woodcrest Ct Unit 4
- 8 Woodcrest Ct Unit 4
- 102 White St
- 16 Jay Rd